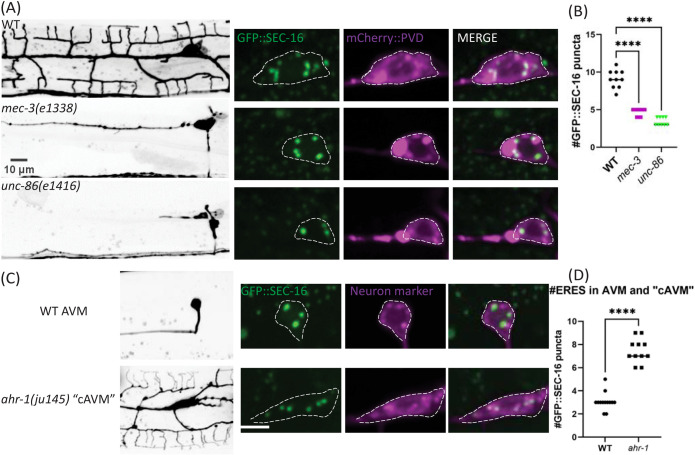
FIGURE 2:
Cell-fate mutants that alter neuron size perturb ERES abundance. (A and C) confocal-fluorescence microscopy of neuron morphology of WT and mutant worms on the left (scale bars = 10 µm, with closeups of soma and an endogenous ERES marker, GFP::SEC-16, on the right (scale bar = 5 µm). (B and D) Quantification of number of GFP::SEC-16 puncta per soma. Significance determined by one-way ANOVA (n ≥ 9 animals) in (B), and Student’s t test two-tailed in (D), ****p < 0.0001, n ≥ 11. Results were additionally repeated in at least two independent experiments.

