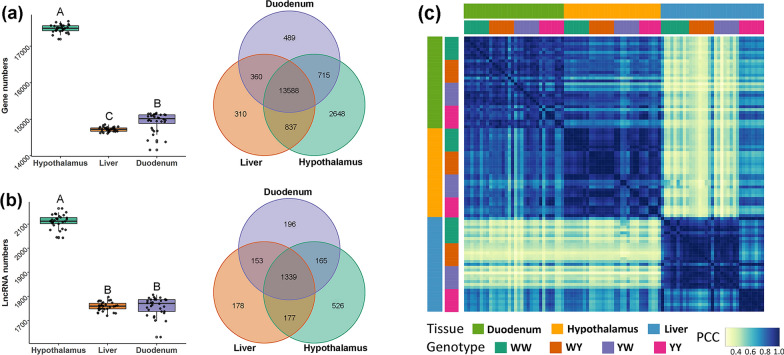
Fig. 1.
Transcriptome landscape of the hypothalamus, liver, and duodenum mucosa in White Leghorn (WL) and Beijing You chicken (YY), and their reciprocal crosses (WY and YW). a Average number of expressed genes, shared genes, and uniquely expressed genes in three tissues. Boxes with different letters differ significantly in the number of expressed genes. The Venn figure was plotted with all the expressed genes in each tissue. b Average number of expressed lncRNA, shared lncRNA, and uniquely expressed lncRNA in the three tissues. Boxes with different letters differ significantly in the number of expressed lncRNA. The Venn figure was plotted with all expressed lncRNA in each tissue. c Pairwise Pearson correlation coefficients (PCC) between each pair of global gene expression

