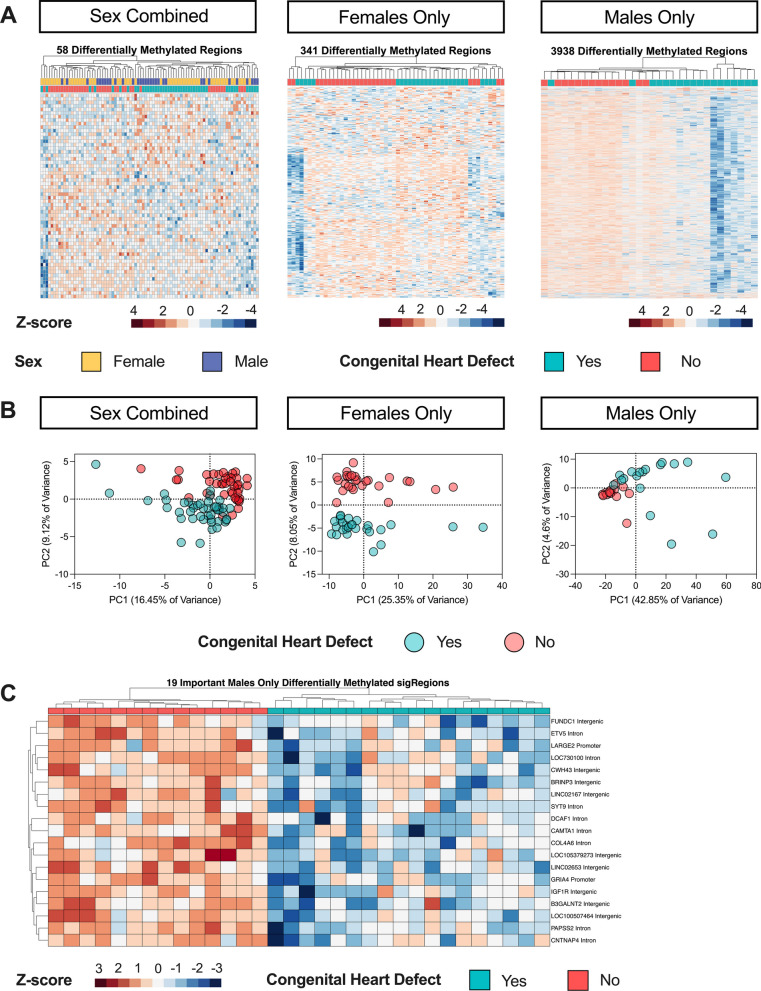
Fig. 2.
DMR profiles of CHD versus non-CHD in Sex Combined, Females Only, and Males Only comparisons within DS. A Heatmaps of nominally significant (p < 0.05) DMRs from DS-CHD versus DS non-CHD samples in Sex Combined, Females Only, and Males Only comparisons. All heatmaps show hierarchical clustering of Z-scores, which are the number of standard deviations from the mean of non-adjusted percent smoothed individual methylation values for each DMR. B PCA analysis using the smoothed methylation values of all DMRs from the Sex Combined and Females Only comparisons and the 1000 most significant DMRs in the Males Only comparison. C Hierarchical clustering heatmap of the machine learning feature selection analysis of the consensus DMRs from the Males Only comparison

