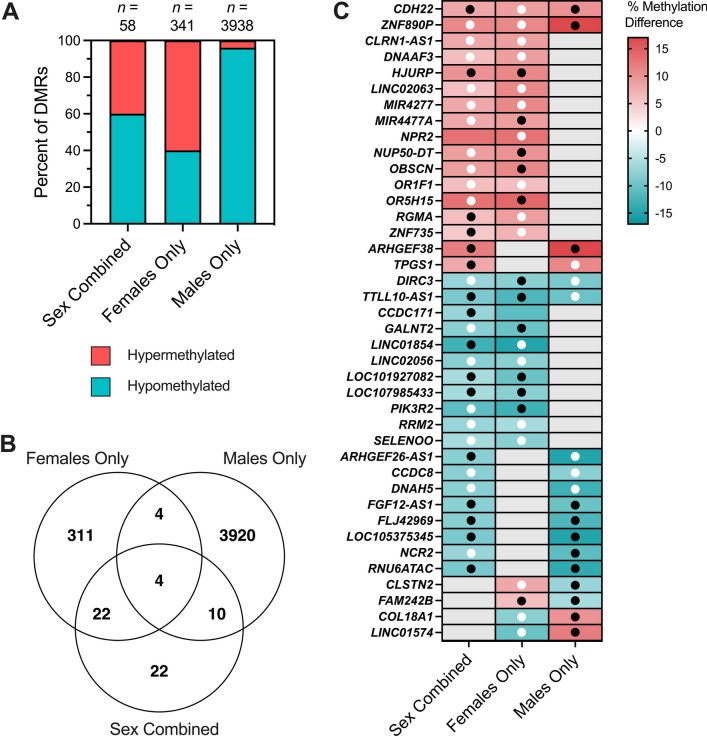
Fig. 3.
Overlapping CHD DMRs across Sex Combined, Female Only, and Male Only comparisons within DS. A The percent of DMRs which were hypermethylated versus hypomethylated in each of the three comparisons. B Venn diagram reflecting the numbers of unique and overlapping DMR genomic coordinates across the three comparisons. C DS-CHD DMRs which overlap in two or more comparisons mapped to genes. Red indicates hypermethylation in CHD compared to non-CHD, while blue represents hypomethylation, with stronger shades representing a greater percent methylation difference. Gray is used when a DMR was not called for that comparison. Black dots indicate methylation in the same direction in the discovery and replication datasets [10 non-CHD (2 female, 8 male) and 11 CHD (6 female, 5 male)], while white dots indicate methylation in the opposite direction in the two datasets. No dot means that the DMR genomic coordinates were not covered in the replication dataset

