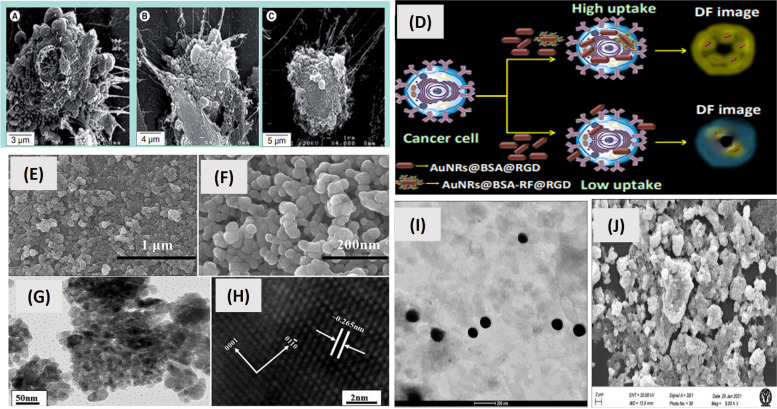
Fig. 10.
SEM image of Me300 melanoma cells in which A) represents cells not exposed to iron oxide nanoparticles while B and C) represent treatment groups exposed to amino ultra-small superparamagnetic iron oxide nanoparticles [250], (D) influence of @BSA-RF@RGD on AuNRs uptake [251], (E) FESEM and TEM images of ZnO nanoparticles in which Low magnification FESEM image, (F) high-magnification FESEM image, (G) Low magnification TEM image of ZnO, and (H) high-magnification TEM image of ZnO showing distance between lattice fringes around 0.265 nm [252], (I and J) TEM and FESEM image of cerium oxide nanoparticles respectively. Adapted with permission from [253]

