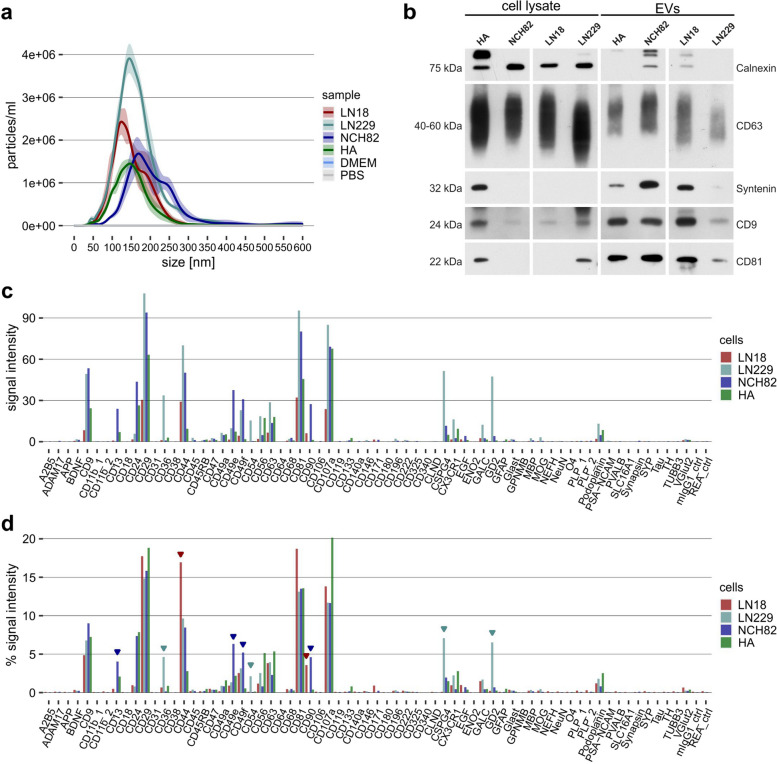
Fig. 2.
Characterization of EVs derived from glioblastoma cells and astrocytes. a Size distribution of EVs separated from cell culture supernatant of LN18, LN229, and NCH82 glioblastoma cell lines as well as from primary human astrocytes (HA). b Western blot analysis of CD9, CD63, CD81, Syntenin (EV markers) and Calnexin (non-EV marker) in EVs separated from cell culture supernatant of glioblastoma cells and primary astrocytes. c EV Neuro median signal intensities for LN18, LN229, NCH82, and HA EVs. d Relative signal intensities of values for cell derived EVs shown in (c). Relative signals are calculated by dividing the signal intensity of a target by the sum of intensities revealed from all markers (total intensity) and presented in percentages. Bars reflect representative marker profiles (n = 1–3 biological replicates). Arrow heads indicate markers that appear elevated in cell lines compared to primary astrocytes

