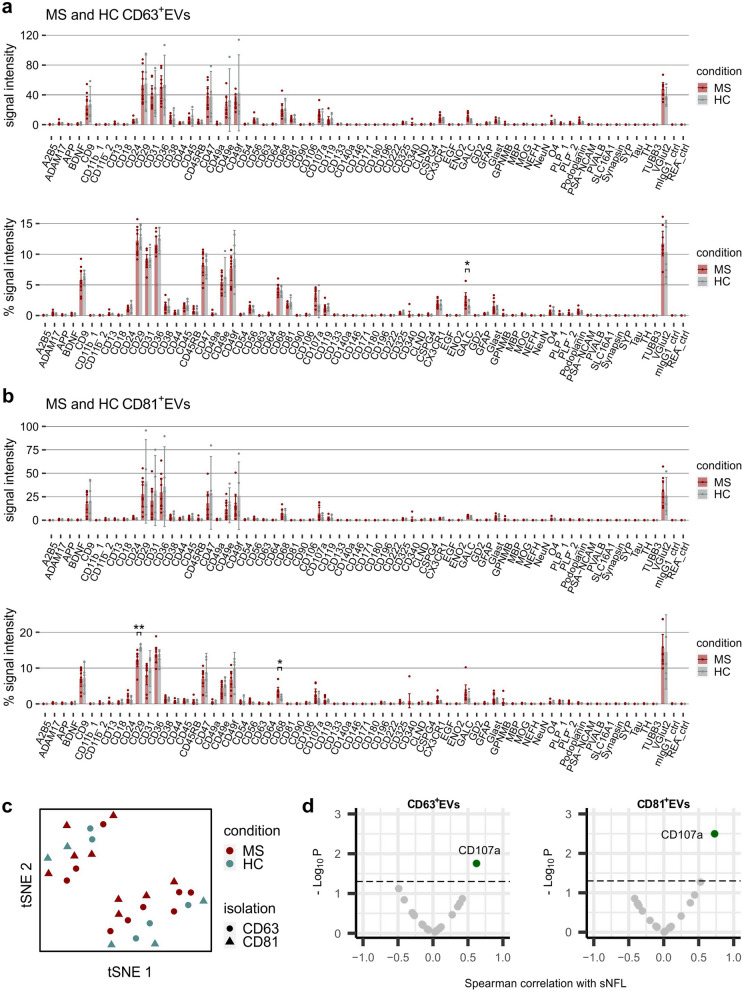
Fig. 5.
Profiling of plasma EVs from MS patients and healthy controls. EV Neuro signal intensities for EVs separated from the plasma of MS patients or HC by CD63- (a) or CD81- (b) immuno-affinity capture, as well as relative signal intensities as signal of target divided by the total signal of all markers (in %). Bars represent mean values and error bars indicate the 95% confidence intervals. Asterisks mark statistically significant differences between MS and HC in relative profiles. Only significant alterations of targets that were consistently detected above background in all individuals are marked. *=p < .05. c tSNE was performed on relative signal intensities of anti-CD63 and anti-CD81 immuno-affinity captured EVs and stratified by condition (color) and isolation procedure (shape). d Volcano blots of Spearman correlation analysis of neurofilament (sNFL) values in blood with relative signal intensities of selected EV Neuro markers in CD63+EVs and CD81+EVs, respectively (dashed line p = .05)

