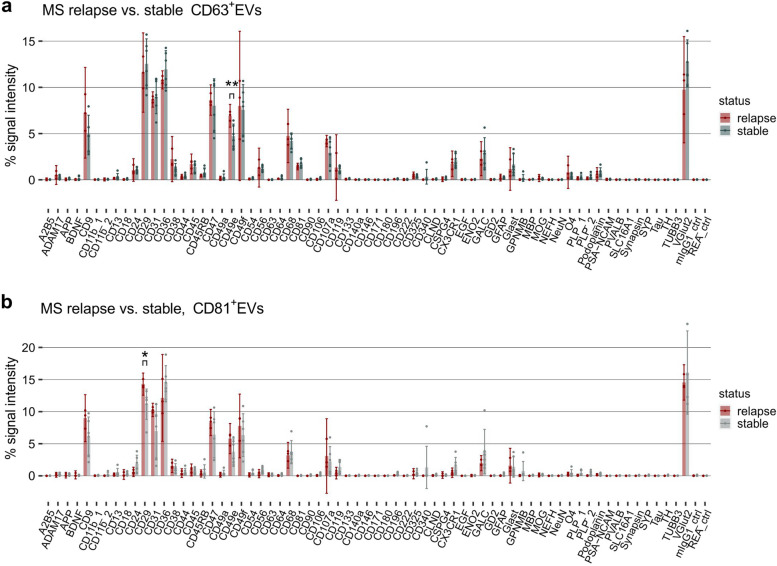
Fig. 6.
Comparison of plasma EVs from MS patients in a relapse versus in a stable disease phase. Relative EV Neuro signal intensities as signal of target divided by the total signal of all markers (in %) for immuno-affinity captured CD63+EVs (a) and CD81+EVs (b). Bars represent mean values and error bars indicate the 95% confidence interval. Asterisks mark statistically significant differences between stable phase and disease relapse. Only significant alterations of targets that were consistently detected above background in all individuals are marked. *=p < .05, **=p < .01

