Fig. 7.
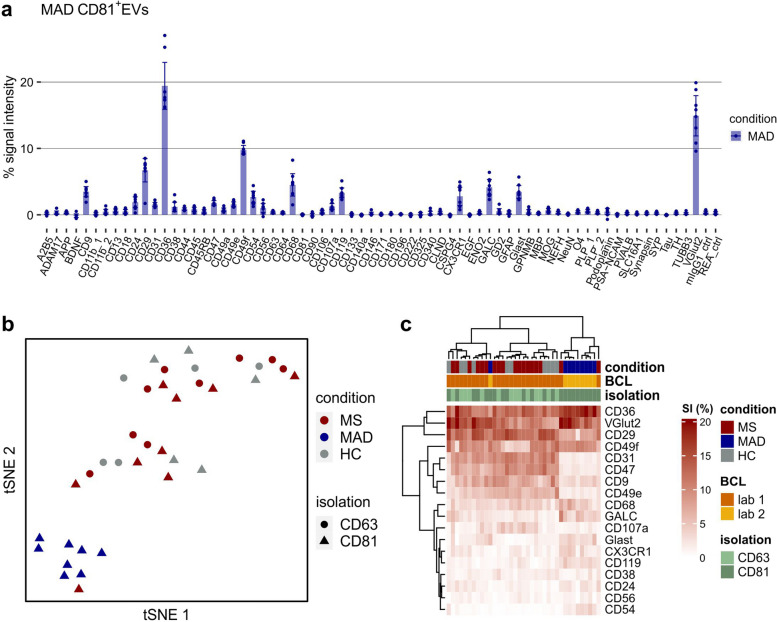
Phenotyping of plasma EVs from MAD patients and comparison of all plasma samples. a Relative EV Neuro signal intensities for EVs separated from the plasma of MAD patients by immuno-affinity capture (anti-CD81) and magnetic separation. Bars represent mean values and error bars indicate the 95% confidence intervals (n = 8 patients). b tSNE of relative signal intensities from all plasma-derived EV samples analyzed (MS, MAD, HC) stratified by condition (color) and isolation (shape). c Heatmap visualization of relative signals for selected targets from all plasma samples analyzed including hierarchical clustering for targets as well as subjects (BCL = lab of blood collection)

