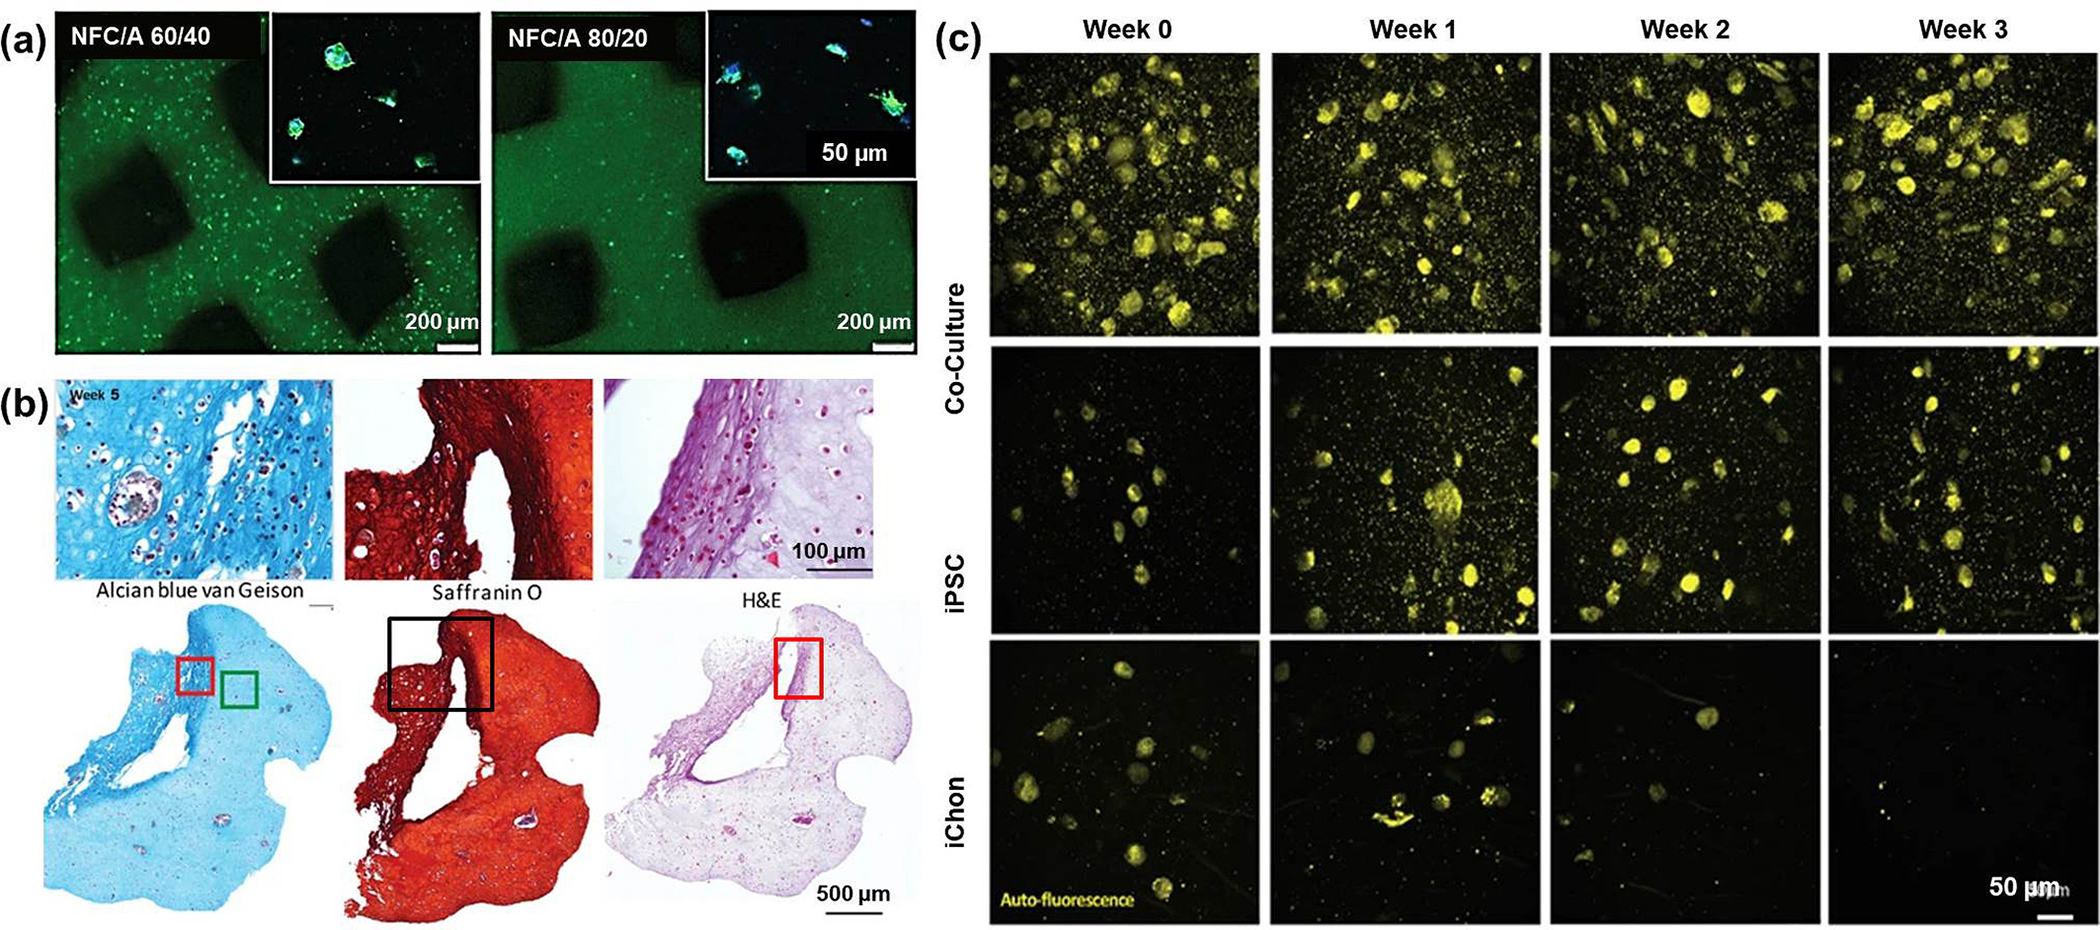
Fig. 6.

(a) Day 5 post printing – better cell viability (green fluorescence) observed with 60:40 NFC: A (scale 200 μm); cell proliferation (blue – DAPI and green – actin) shown in the upper right corner (scale 50 μm); (b) Alvin blue, Safranin O, hematoxylin and eosin (H&E) stained zoomed and complete 3D architecture images (100 μm and 500 μm) of iPSCs with iChons at 5th week; (c) two-photon excitation fluorescence microscopy images of co-culture, oPSC, and iChons after 0, 1, 2 and 3 weeks (scale 50 μm) [85].
