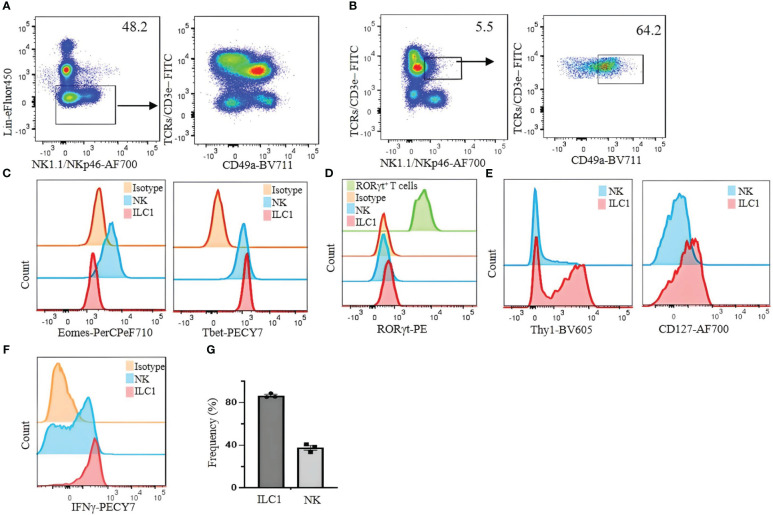
Figure 2.
Limitations of CD49a as a selective marker for identifying liver ILC1s in C57BL/6 mice. (A) Lin− cells were analyzed for the expression of CD49a on T cells. (B) NKT cells (TCRs/CD3ϵ+/NK1.1/NKp46+) were analyzed for CD49a expression. (C) Eomes and T-bet were analyzed on liver NK cells and ILC1s. (D) RORγt expression on liver NK cells and ILC1s; Lin−TCR/CD3ϵ+RORγt+ cells were used as positive control (green histogram). (E) Thy1 and CD127 expression on liver ILC1s and NK cells were analyzed. (F) Liver lymphocytes were incubated with phorbol 12-myristate 13-acetate (PMA)/ionomycin plus Brefeldin A for 4 hours and stained for intracellular IFNγ. CD49a−CD49b+ NK cells and CD49a+CD49b− ILC1s were gated and analyzed for intracellular expression of IFNγ. Numbers indicate percentages of cells in indicated gates. (G) Frequency of IFNγ expressing ILC1 and NK cells. Data are shown as mean ± SEM.

