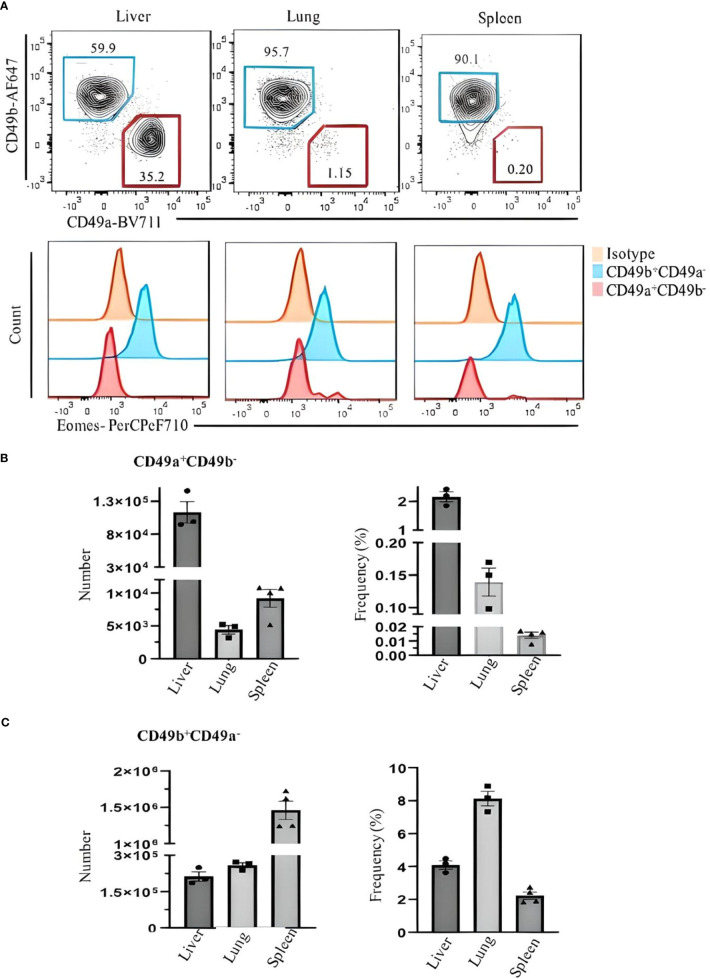
Figure 3.
Comparing Eomes expression in ILC1s and NK cells in the liver, lung, and spleen of C57BL/6 mice. (A) Live CD45+Lin−NK1.1+NKp46+CD3ϵ/TCRs− were gated and analyzed for CD49a and CD49b expression. Blue and red gates show CD49b+CD49a− NK cells and CD49a+CD49b− ILC1s, respectively. Numbers indicate percentages of cells in each gate. (B) Frequency and number of CD49a+CD49b− and (C) CD49b+CD49a− cells of CD45+ leukocytes in liver, lung, and spleen. Data are shown as mean ± SEM.

