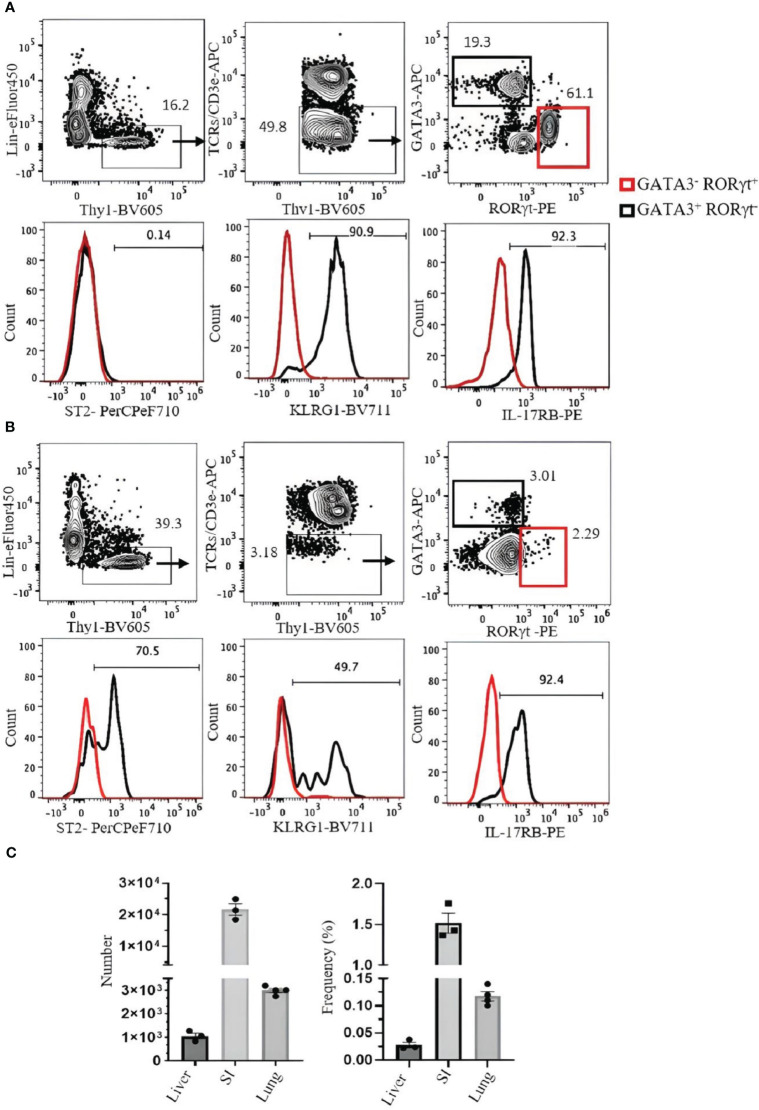
Figure 6.
Analysis of ILC2s in the small intestine (SI) and liver of C57BL/6 mouse. (A) ILC2s in the SI were gated as Thy1+Lin−TCRs/CD3ϵ−ST2+GATA3+RORγt−, and RORγt+ILC3s (red square) were used as negative control. Histograms show the expression of ST2, KLRG1, and IL-17RB on ILC2s. (B) ILC2s in the liver were gated as Thy1+Lin−TCRs/CD3ϵ−GATA3+RORγt−. RORγt+ILC3s (red square) were used as negative control. Histograms show the expression of ST2, KLRG1, and IL-17RB. Gating was applied on live, single-cell, CD45+ leukocytes. Numbers indicate percentages of cells in each gate. (C) Frequency and number of ILC2s (of CD45+ leukocytes). Data are shown as mean ± SEM.

