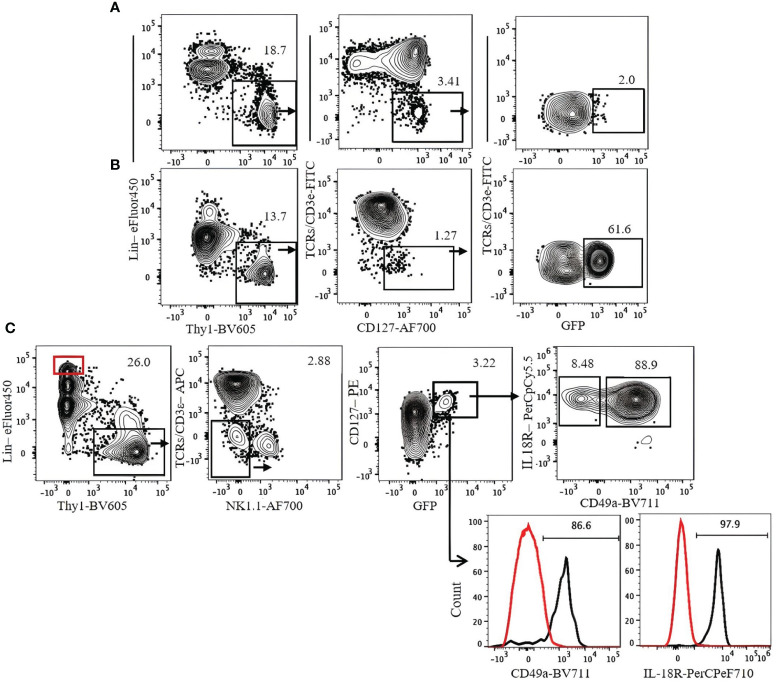
Figure 9.
Gating strategy for ILC3 characterization in Rorc(γt)-eGFP mice. (A) Lung. (B) Spleen. (C) Expression of CD49a and IL-18R on lung ILC3s. Lin+Thy1− cells (red gate and red histogram) were used as control. Gating applied on live CD45+lin−Thy1+TCRs/CD3ϵ−NK1.1−CD127+GFP+ cells. Lin cocktail included Ter119, CD19, B220, CD11c, CD11b, and GR-1. Numbers indicate percentages of cells in each gate.

