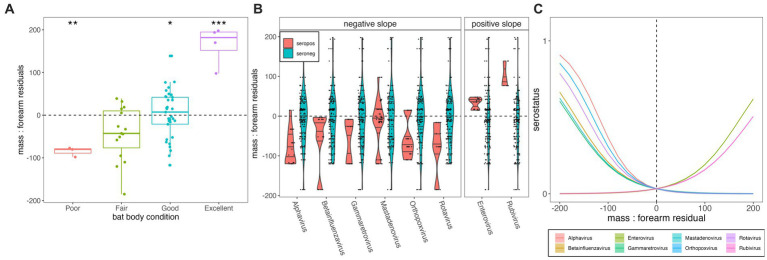
Figure 3.
(A) Mass:forearm residual (y-axis) by body condition score (x-axis); raw data are plotted as points with the interquartile range and median of each category indicated by the upper, lower, and middle bars of the boxplot. Statistically significant categorical predictors of mass:forearm residual by linear regression are indicated by stars (*p < 0.05, **p < 0.01, and ***p < 0.001). (B) Distribution of mass:forearm residual (y-axis) in seropositive (orange) vs. seronegative (blue) individuals, across diverse viral genera (x-axis). Genera are grouped according to statistically significant interactions demonstrating negative (left) and positive (right) associations between seropositivity and mass:forearm residual, as determined via generalized linear mixed effects regression and subsequent Bonferroni correction (C). Interaction plot of the relationship between serostatus (1 = seropositive; 0 = seronegative) and mass:forearm residual across 8 viral genera that demonstrated significant associations. Mass:forearm residuals by serostatus and resulting slopes from generalized linear regression are plotted for all viruses tested, including those for which no significant interaction was demonstrated, in Supplementary Figures S4, S5. Translucent shading (very narrow) corresponds to 95% confidence intervals by standard error.

