
Figure 4: Association between individual characteristics and having received diabetes preventive services.
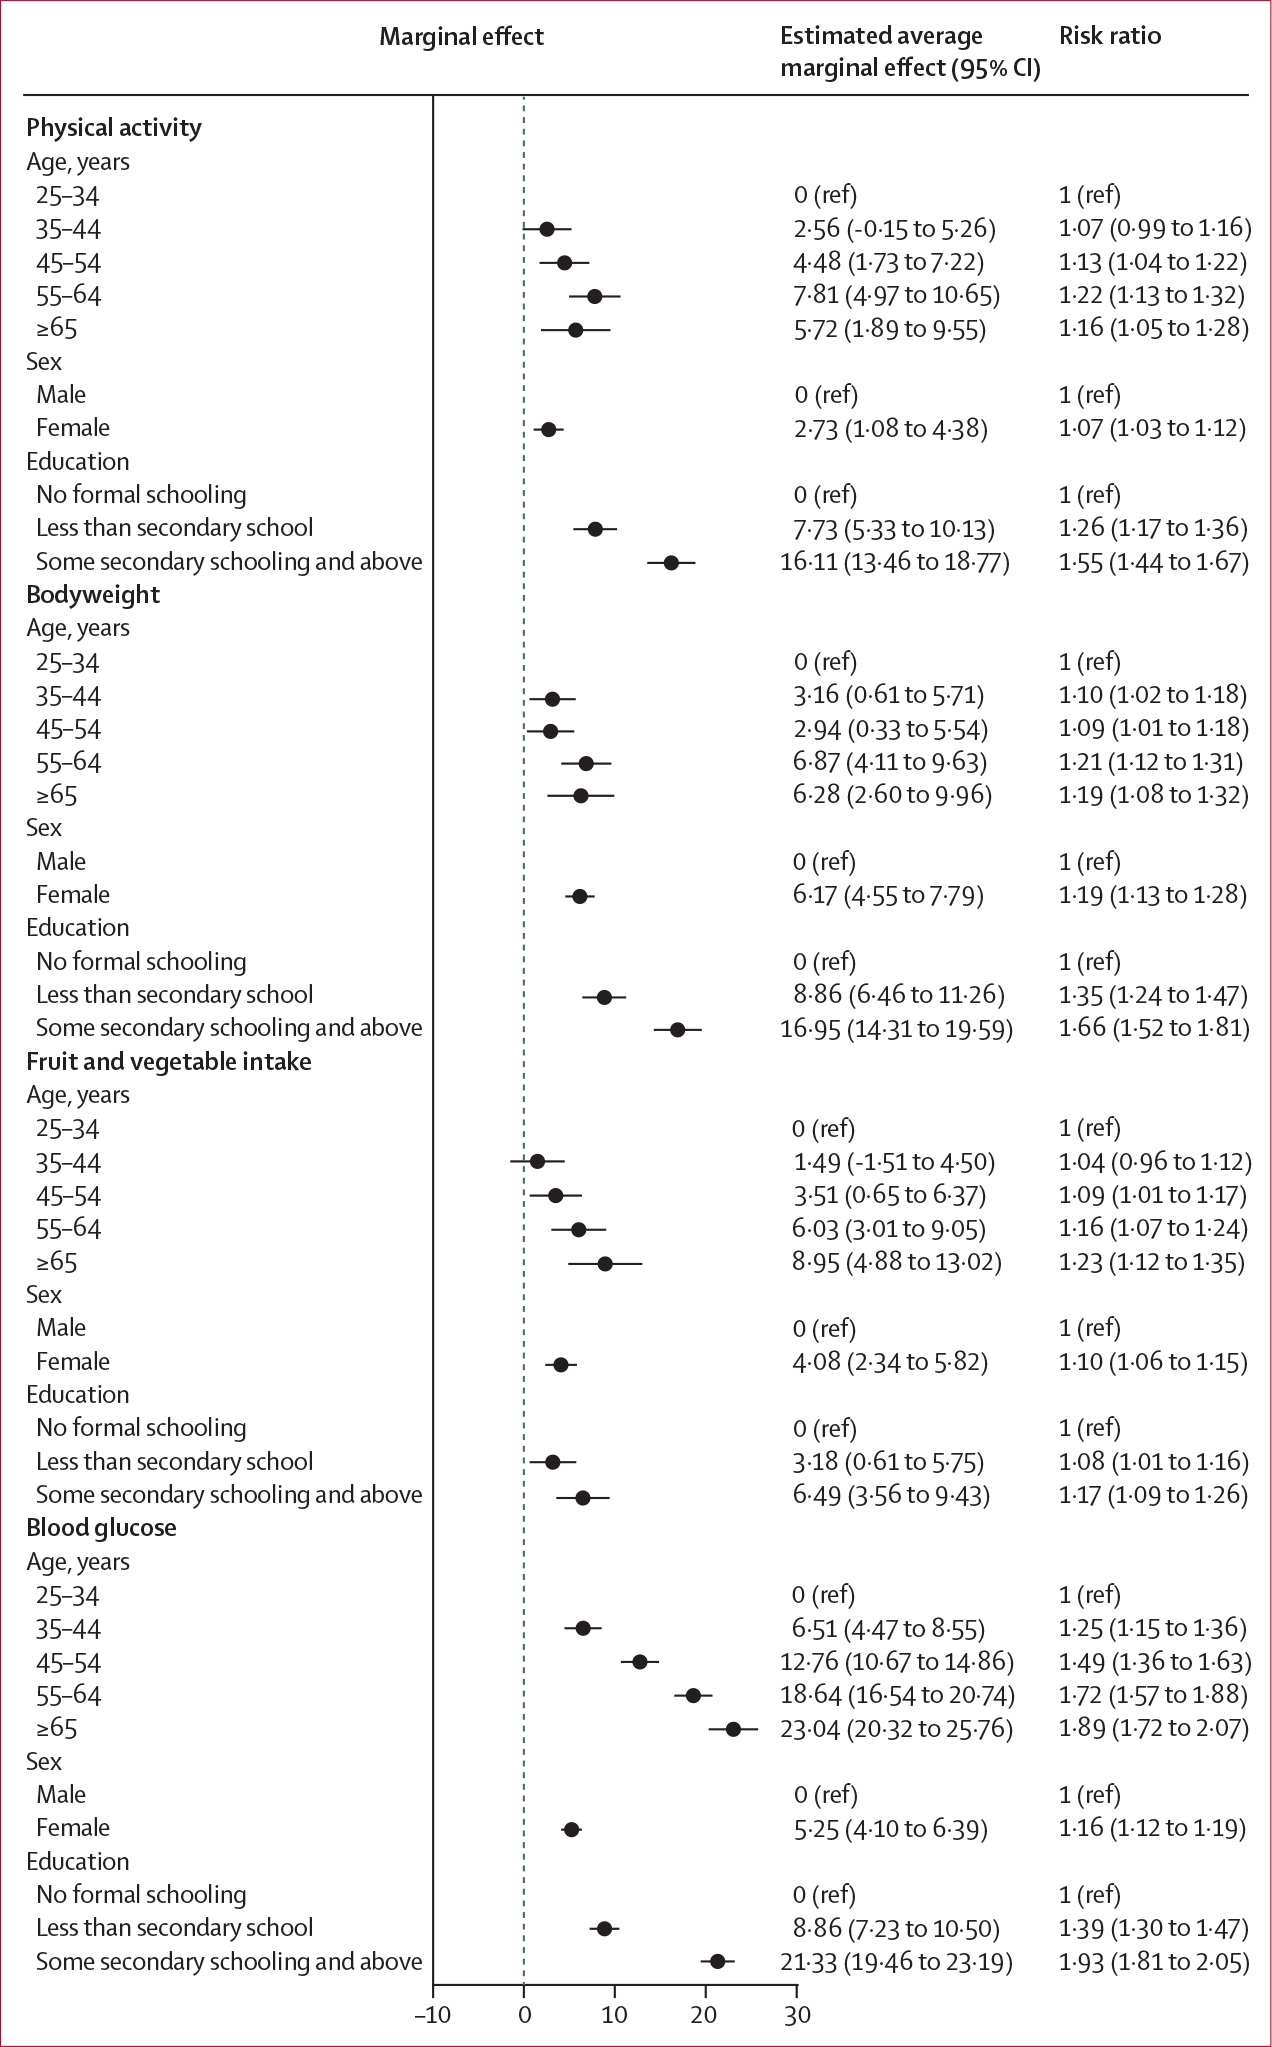
The marginal differences and 95% CIs in predicted probability of reporting having received each preventive service are depicted, with the base category for each sociodemographic characteristic serving as the reference point. Units for the estimated average marginal effect are percentage point differences in predicted probability. Error bars represent 95% CIs. Models were estimated with sampling weights readjusted to represent each country equally, and accounted for country-level fixed effects.