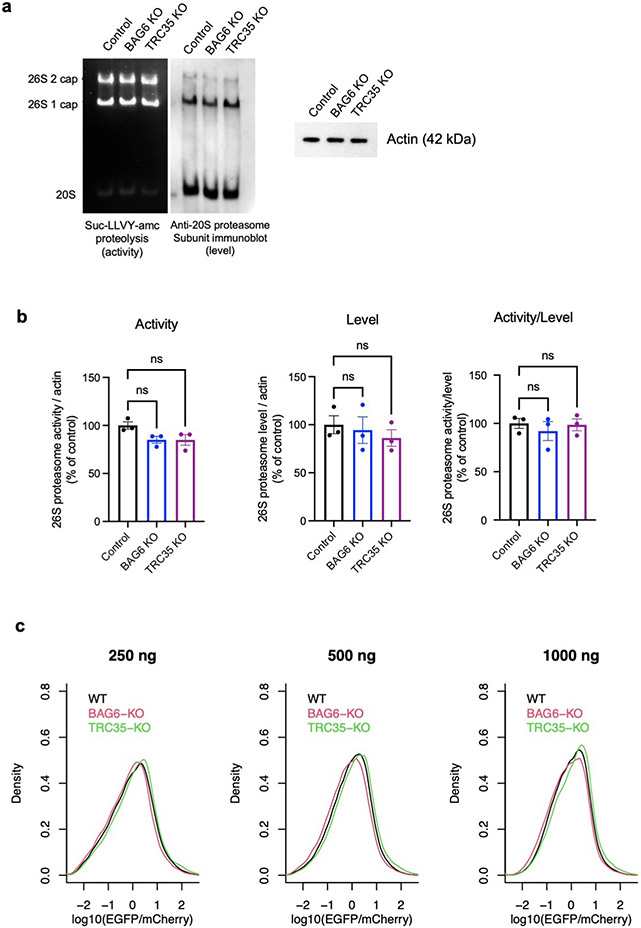
Extended Data Fig. 8 ∣. BAG6 or TRC35 knockout does not affect proteasome activity or level.
a, Representative result from in-gel proteasome activity assay showing proteasome hydrolysis activity (left) and representative immunoblot probing for a subunits levels of the 26S 1- and 2-cap proteasome and 20S proteasome (middle). Cell lysates were run on 4% nondenaturing (native) gels and incubated with fluorogenic Suc-LLVY-amc proteasome substrate to determine relative activities or immunoblotted to determine relative levels. Samples (10.5 μg protein/well) were run separately under denaturing conditions for immunoblot probing for actin as a sample processing control (right). b, The level of 26S 1- and 2-cap proteasome detected by immunoblotting normalized to actin in the same sample (left), densitometric quantification of 26S 1- and 2-cap proteasome in-gel activity normalized by actin in the same sample (middle), and the activity/level ratio (right). Data are expressed mean ± SEM for three biological replicates, where each value represents the activity/level ratio calculated by averaging four technical replicates of activity and level values. One-way ANOVA was used for statistical analysis, with P < 0.05 considered significant. c, Similar result with in vivo proteasome activity reporter assays. The proteasome activity reporter UbG76V-EGFP was co-transfected with mCherry (1:1) into cells and the EGFP/mCherry ratio measured by flow cytometry was used as an indicator of proteasome activity in cells. The distribution the EGFP/mCherry ratio in WT, BAG6 KO, and TRC35 KO cells at 250 ng, 500 ng, and 1000 ng total plasmid were shown.

