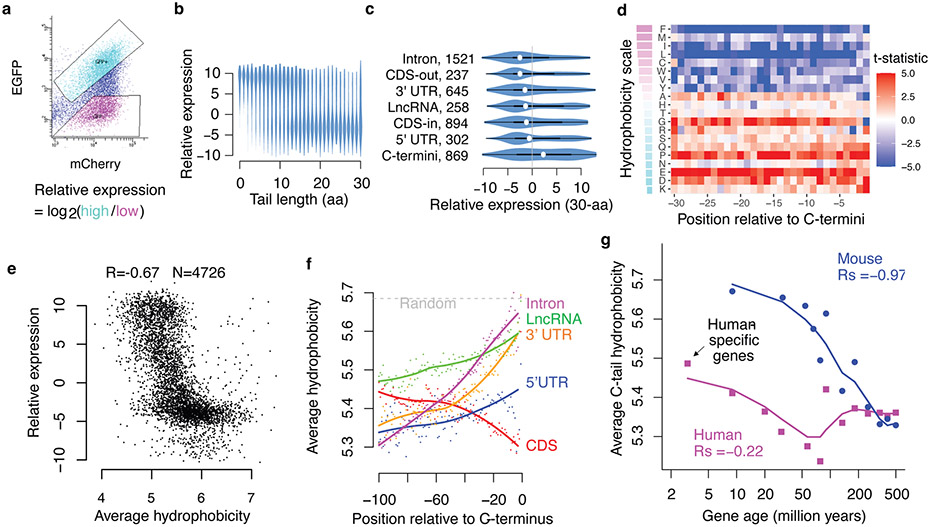
Fig. 2 ∣. Noncoding translation mitigation is associated with C-terminal hydrophobicity.
a, Pep30 stable cells were sorted into high and low EGFP bins and the tail sequences (DNA) were cloned and sequenced. The relative expression of each sequence is calculated as the log2 ratio of read counts in EGFP-high vs. EGFP-low bin. b, Violin plots of relative expression for tails of varying lengths. c, Violin and box plots comparing expression of 30-aa tails encoded by various types of sequences. The box indicates the minima, maxima, upper and lower quartiles and the white dot indicates the median value. The number of sequences in each category is indicated. CDS-out: frameshifted CDS. CDS-in: inframe CDS. d, A heatmap visualizing the association (Two-sided Student’s t-test statistics capped at 5.0) between expression and the presence of each amino acid at every position in the Pep30 library. Amino acids (rows) are sorted by hydrophobicity (Miyazawa scale). e, Average hydrophobicity vs. relative expression scatter plot for tails of 30-aa length. f, Genome-scale average hydrophobicity at each residue within the last 100-aa of peptides encoded by coding (>=200aa) and various noncoding sequences (>=30aa). g, Average C-tail (last 30aa) hydrophobicity of human (magenta) and mouse (blue) genes grouped by age based on time of origination estimated from vertebrate phylogeny. The lines are a loess fit of the dots.

