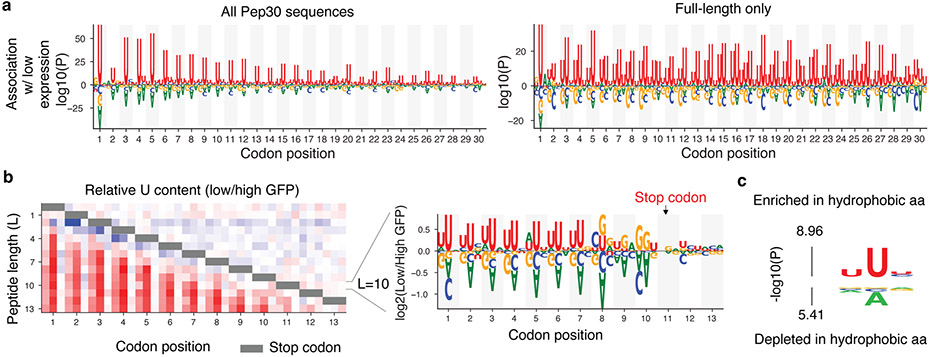
Fig. 3 ∣. A bias in the genetic code links instability and hydrophobicity with U-content.
a, Nucleotides enriched/depleted in reporters of low EGFP expression in the Pep30 library using all sequences (left) or only sequences encoding a full-length 30aa peptide (right). Nucleotides height scaled by log10 transformation of two-sided Mann-Whitney U test P values. b, A heatmap color-coding the log2 ratio of U frequency between Pep13 sequences in GFP-low bin vs. GFP-high bin for each nucleotide and codon position (column) and peptide length (L, row). Color bar: from −1 (blue) to +1 (red). Gray bar indicates positions of stop codons. Relative frequency of all four bases for L=10 (stop codon at codon position 11) are shown on the right. c, Probability logo showing enriched and depleted nucleotides in codons of hydrophobic amin acids in the genetic code. P values were computed using two-sided Mann-Whitney U tests.

