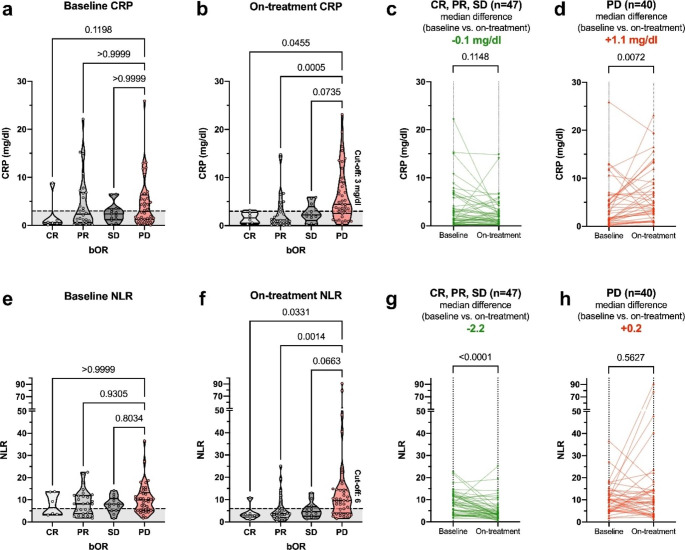
Fig. 2.
CRP and NLR levels according to bOR and time points. CRP (a, b) and NLR (e, f) levels are shown according to the bOR at baseline and on-treatment (day 40 ± 10). PD was compared to SD, PR and CR, respectively, employing Kruskal-Wallis testing and multiple comparison using Dunn’s correction. The cross-validated on-treatment cut-off points for progression (CRP: 3 mg/dl; NLR: 6) are shown as a dashed line on baseline and on-treatment graphs. Kinetics of baseline and on-treatment CRP (c, d) and NLR levels (g, h) split according to patients presenting with PD and disease control (CR, PR, SD) are shown as individual line plots. CRP and NLR level differences between the two time points were compared by the Wilcoxon test for paired samples. Abbreviations: bOR, best overall response; CR, complete response; CRP, C-reactive protein; NLR, neutrophil-to-lymphocyte ratio; PD, progressive disease; PR, partial response; SD, stable disease

