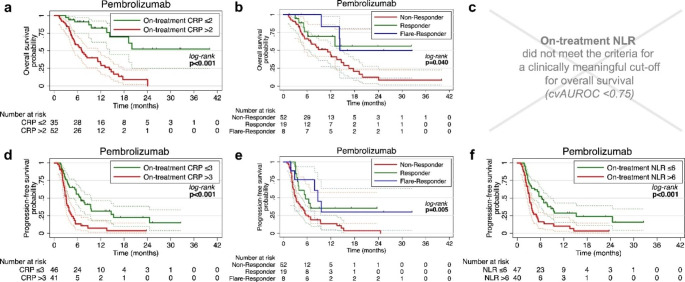
Fig. 3.
Survival analysis. Kaplan-Meier plots with CI95% (dashed lines) for OS and PFS dichotomized by the cross-validated cut-off points for on-treatment CRP in mg/dl (a, d), CRP kinetics (b, e), on-treatment NLR (c, f) levels are shown. Log-rank testing was used for comparison of the survival curves. Abbreviations: CI95%, 95% confidence interval; CRP, C-reactive protein; cvAUROC, cross-validated area under the receiver operating curve; NLR, neutrophil-to-lymphocyte ratio; OS, overall survival; PFS, progression-free survival

