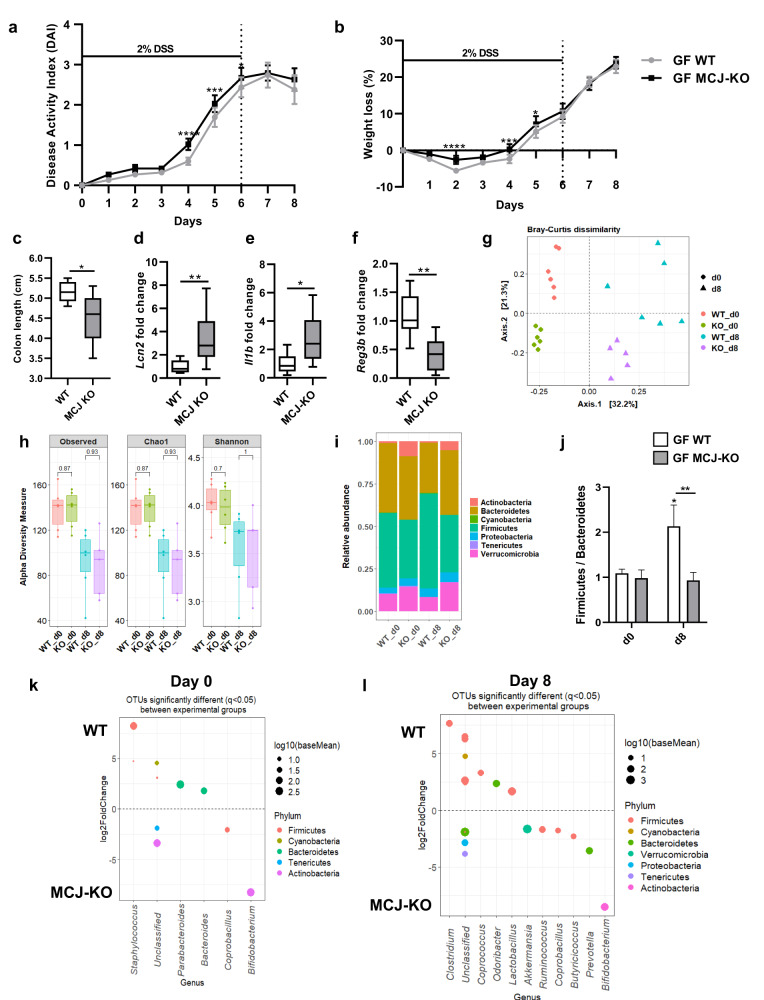
Fig. 1. Germ-free mice colonization with WT and MCJ-deficient mice microbial communities.
a Disease activity index (DAI) and b weight loss percentage; data are means ± SEM and analyzed using two-way ANOVA. c Colon length (cm). d–f Gene expression analysis from murine colon tissue of the d Lcn2, e Il1b and f Reg3b genes shown as mean fold change of GF mice colonized with MCJ-deficient microbial consortia compared to GF mice colonized with bacterial community from WT mice. c–f Data are represented as box and whisker plots of median, quartiles and range with at least 8 mice per group. For statistical analysis, Mann-Whitney U test was performed. g Principal Coordinates Analysis (PCoA) plot of bacterial beta-diversity based on Bray-Curtis dissimilarities showing experimental groups after bacterial colonization (WT_d0 and KO_d0) and after colitis induction (WT_d8 and KO_d8). h Bacterial alpha diversity analysis by means of observed Operational Taxonomic Units (OTUs), Chao1 and Shannon indexes (P value < 0.05, Wilcoxon rank-sum test). i Stacked bar plots showing the average relative abundance of each group at phylum level. j Box plot representation of Firmicutes/Bacteroidetes ratio. Boxes represent mean ± SEM and data were analyzed using two-way ANOVA. “*” above boxes versus control genotype (d8 versus d0), “*” above line versus different genotypes in the same experimental group. k, l DESeq2 displayed OTUs that were differentially abundant between groups k before DSS administration (WT_d0 and KO_d0) and l at the end of the experiment (WT_d8 and KO_d8). Each point represents a single OTU colored by phylum and grouped by taxonomic genus. Point´s size reflect the mean abundance of the sequenced data.

