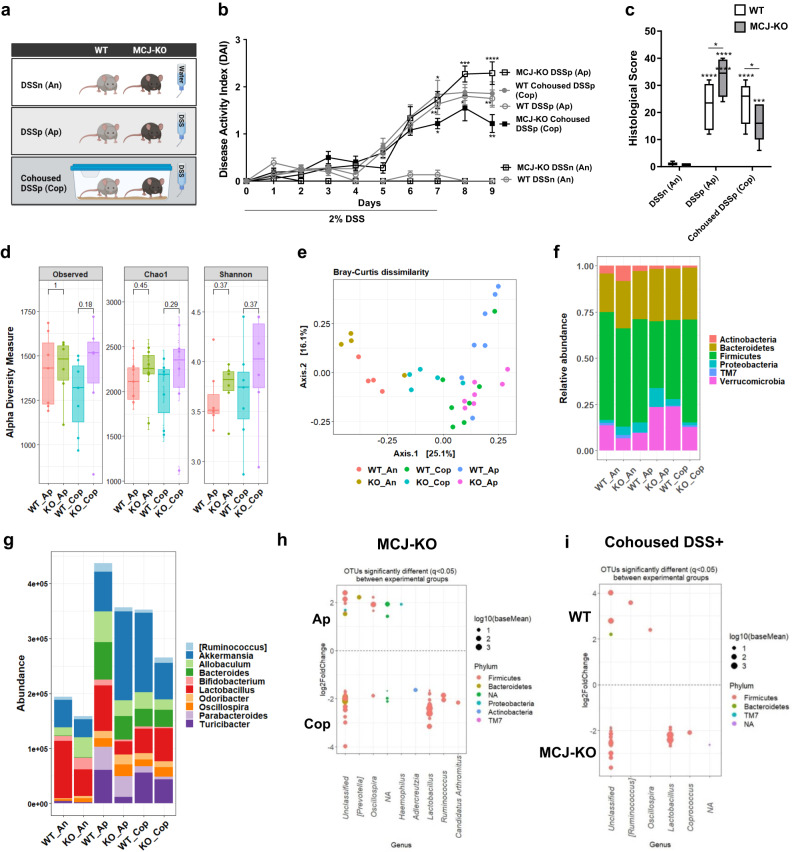
Fig. 2. Fecal microbial transplantation via WT and MCJ-deficient animal housing.
a Schematic representation of the different experimental groups. b DAI expressed as means ± SEM and analyzed with a two-way ANOVA statistical test. Statistical differences are represented by asterisks (*) above the line of MCJ-KO DSS-treated alone for MCJ-KO DSS-treated alone and cohoused comparison, below the line of WT DSS positive and alone mice for WT and MCJ-KO DSS-treated alone comparison, and below the line of MCJ-KO DSS-treated and cohoused group, for cohoused DSS positive WT and MCJ-KO mice. c Histological score (at least n = 9 mice per group in DSS-treated groups). White boxplots indicate WT and grey boxplots MCJ-KO mice. Data were analyzed using two-way ANOVA, where an asterisk “*” above the box shows every DSS positive group versus the control. Differences between genotypes in the same experimental group are presented as a line with an asterisk (*). Significant differences within the same mice genotype between DSS-treated housed alone and cohoused groups are represented with an asterisk (*) inside the box of WT and MCJ-deficient mice that were housed alone (DSS+) d Observed OTUs, Chao1 and Shannon alpha diversity indexes (P value < 0.05, Wilcoxon rank-sum test). e PCoA plot of bacterial beta-diversity based on Bray-Curtis dissimilarities showing distinct grouping between healthy and DSS-treated experimental groups (Statistical test, ANOSIM). f Stacked bar chart at phylum level. g Relative abundance of the top 10 most abundant genera. h, i DESeq2 identified differentially abundant OTUs between h MCJ-deficient housed alone and cohoused (KO_Ap vs KO_Cop) and i cohoused groups (WT_Cop and KO_Cop). WT/KO_DSSn/An: WT and MCJ-KO DSS negative; WT/KO_DSSp/Ap: WT and MCJ-KO housed alone DSS positive; WT/KO _Cohoused DSSp/Cop: WT and MCJ-KO cohoused DSS positive.

