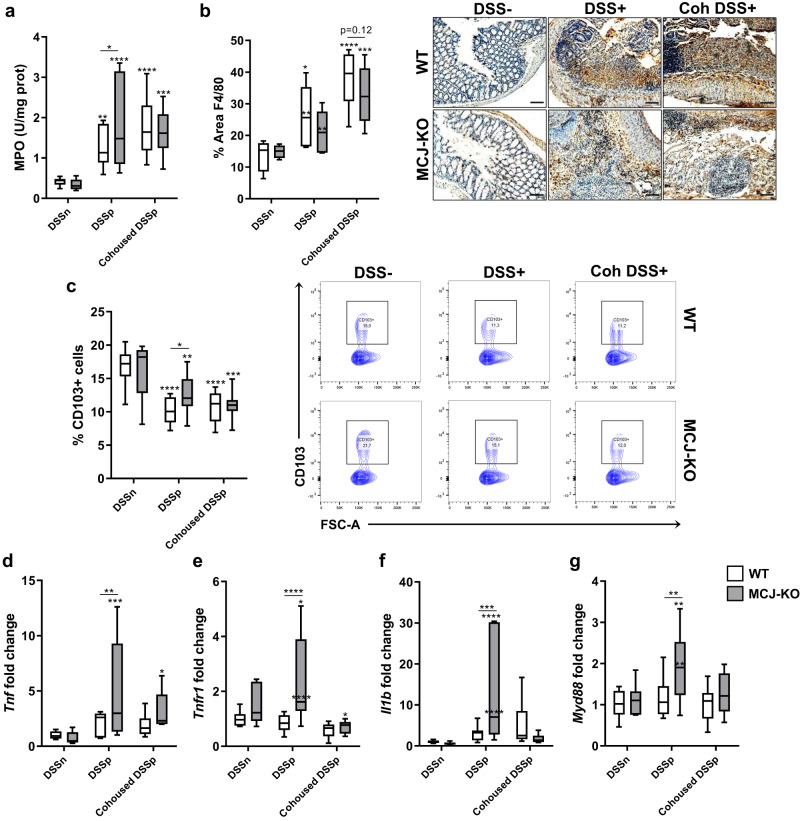
Fig. 3. Evaluation of cohousing impact during UC.
a Myeloperoxidase activity (U/mg prot). b Quantification of macrophage area (%) in colon tissue by immunohistochemistry (Anti-F4/80 antibody) and representative images (scale bar, 100μm). c Percentage of CD103+ dendritic cells from total immune cells within the mesenteric lymph nodes (n = 13 within cohoused groups) and representative flow cytometric plots of CD103+ population from all experimental groups. d–g Gene expression analysis from murine colon tissue of d Tnf, e Tnfr1, f Il1b and g Myd88. a–g White boxplots indicate WT and grey boxplots MCJ-KO mice. Data are represented as box and whisker plots of median, quartiles and range with at least 8 mice per group (in DSS-treated groups), and at least 7 mice per group (in cohousing groups). For statistical analysis, two-way ANOVA was used as applicable; *P value < 0.05, **p < 0.01, ***p < 0.001, ****p < 0.0001. An asterisk “*” upside the box shows significant differences versus the control (DSS−). Significant differences within the same mice genotype between DSS-treated housed alone and cohoused groups are represented with an asterisk (*) inside the box of WT and MCJ-deficient mice that were housed alone (DSS+). Differences between genotypes in the same experimental group are presented as a line with asterisks (*).

