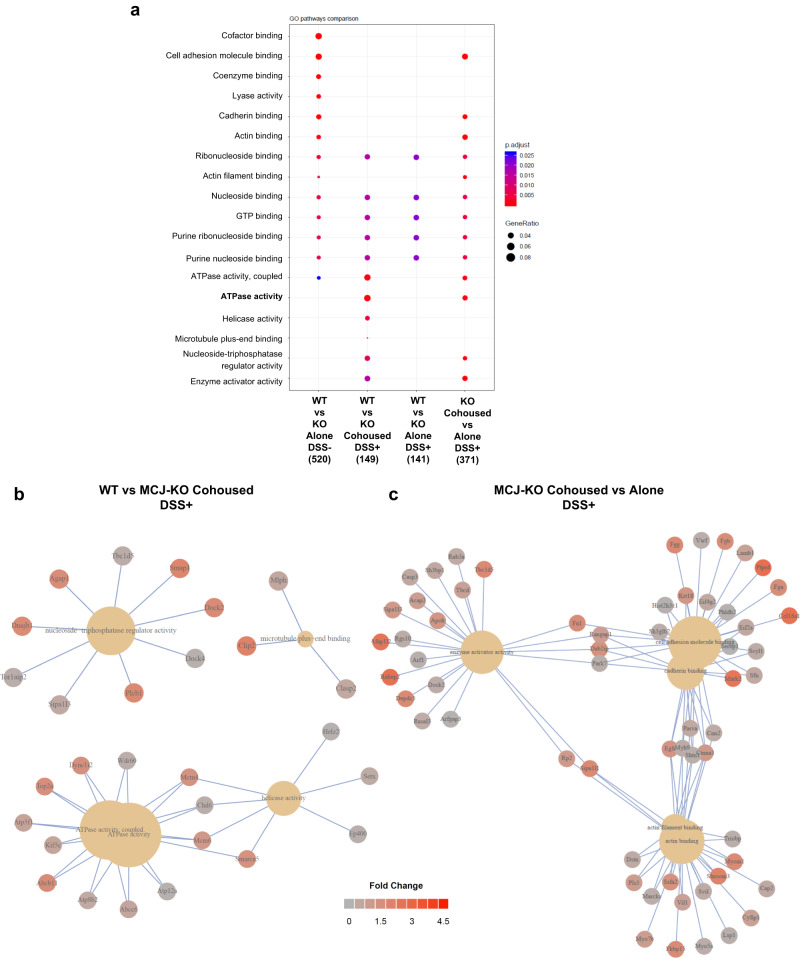
Fig. 4. Differential proteome analysis of cohoused mice during UC.
a GO pathway enrichment analysis. The dot plot shows the up-regulated proteins linked to molecular function (MF) GO pathways (FDR < 0.05) in the different comparisons. Dot size reflects gene count enrichment in the pathway, and dot color displays pathway enrichment significance (adjusted P), being red color the most significant. b, c Proteins implicated in the most significant GO pathways (Molecular function) b cohoused (WT vs MCJ-KO) and c MCJ deficient (Cohoused vs Alone) mice with colitis.

