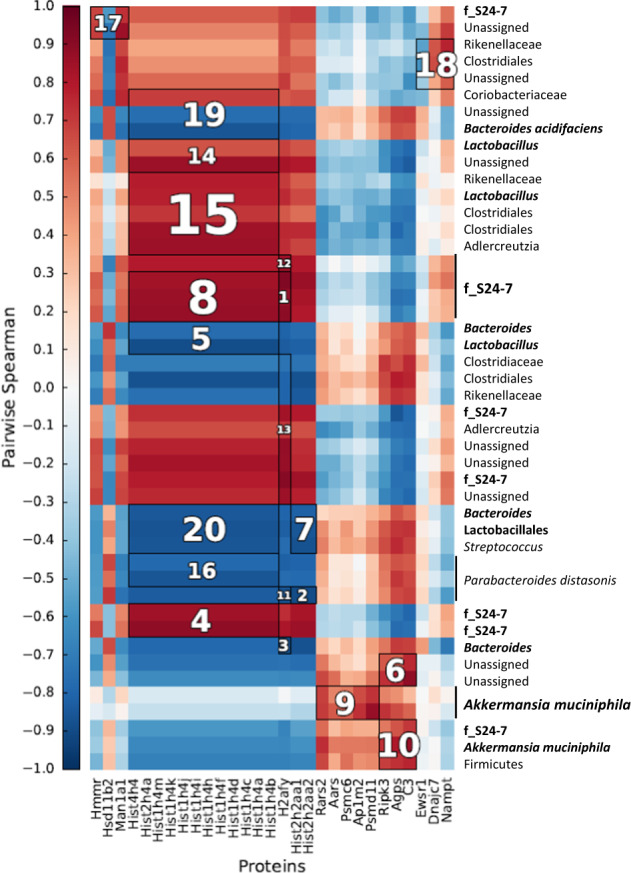
Fig. 5. Heatmap of Spearman’s rank correlation coefficients.

Associations were determined between bacterial OTUs from WT and MCJ-KO mice treated with DSS and proteins enriched in the colon tissue. To identify significant associations (adjusted P < 0.05), Hierarchical All against-All Association (HAIIA) testing was performed. Clusters are ranked according to their significance (adjusted P) from 1 to 20 i.e.1 represents the most significant correlation. Red colors illustrate positive correlations and blue colors illustrate negative correlation coefficient.
