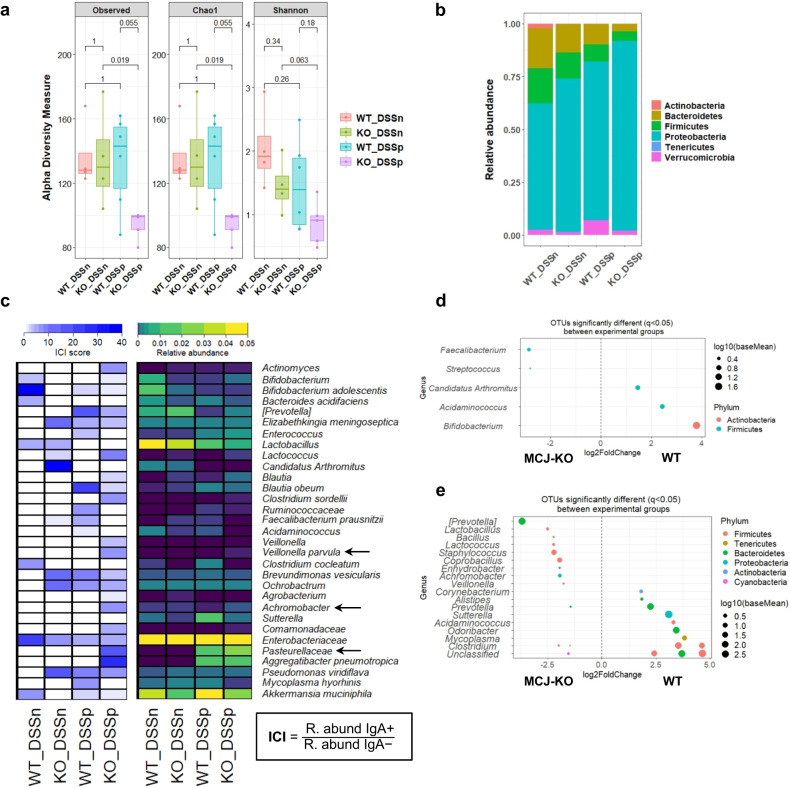
Fig. 6. Differential IgA-coating of WT and MCJ-deficient mice intestinal microbiota.
a Observed OTUs, Chao1 and Shannon alpha diversity indexes of bacteria coated with IgA (IgA + ) (P value < 0.05, Wilcoxon rank-sum test) b Taxa-bar plot at phylum level of intestinal bacteria coated with IgA in all experimental groups. c Heatmap representation of IgA coating index (ICI) score and relative abundances of specific bacterial families, genera and species coated with IgA. To calculate the ICI score the relative abundance of the IgA+ fraction was divided by the IgA- fraction. In the ICI score heatmap, dark blue represents the highest ICI value and in the relative abundance heatmap, yellow color shows the highest relative abundance. d, e Differentially abundant OTUs identified through DESeq2 testing (adjusted P < 0.05) between d WT and MCJ-deficient mice gut bacteria coated with IgA in homeostasis (WT_DSSn vs KO_DSSn) and e in intestinal inflammation (WT_DSSp vs KO_DSSp).

