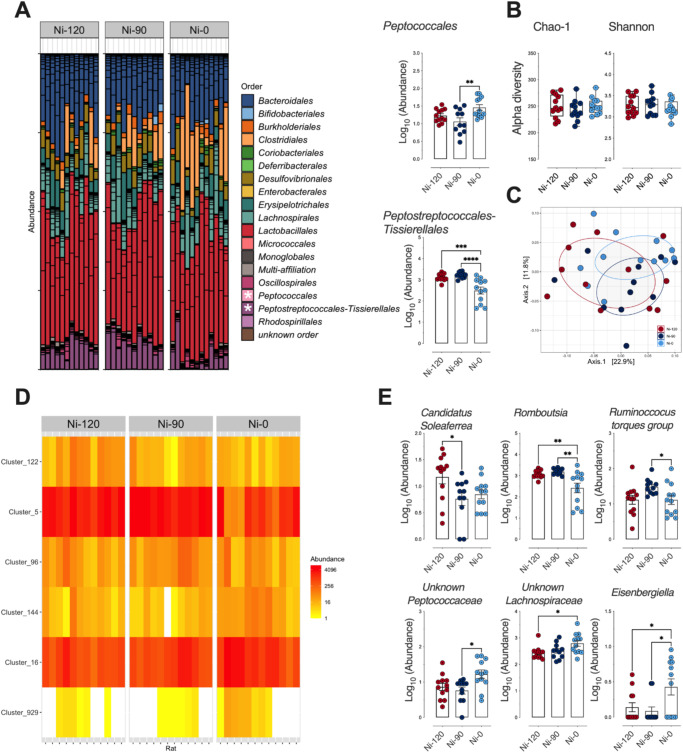
Fig. 3. Impact of sodium nitrite levels in cooked ham models (0 vs 90 vs 120 mg/kg) on fecal microbiota.
A Distribution of bacterial communities at the order level. * Significant impact on Peptococccales and Peptostreptococcales-Tissierellales using differential abundance analysis at the order level (Deseq2, Padj ≤ 0.05): Normalized Log10 abundances were represented using scatter plots with bar (mean ± sem, n = 12). B Alpha diversity: No significant impact seen on richness (Chao-1) or eveness (Shannon). Individual values are represented using box and whiskers ( + mean). C Beta diversity (Unifrac distances, manova p > 0.05). No significant difference between microbiota of rats fed the 3 cooked ham model diets. D Heatmap of clusters agglomerated at the genus level affected by sodium nitrite content in ham-based diets. Padj ≤ 0.05 using differential abundance analysis (Deseq2). E Normalized abundance of the 6 clusters displaying dose effects as a function of dietary sodium nitrite content in (D). Clusters are agglomerated at the genus level and normalized Log10 abundances were represented using scatter plots with bar (mean ± sem, n = 12), significance was determined by a Kruskal-Wallis followed by Dunn’s mean comparison test.**p ≤ 0.05; **p ≤ 0.01.

