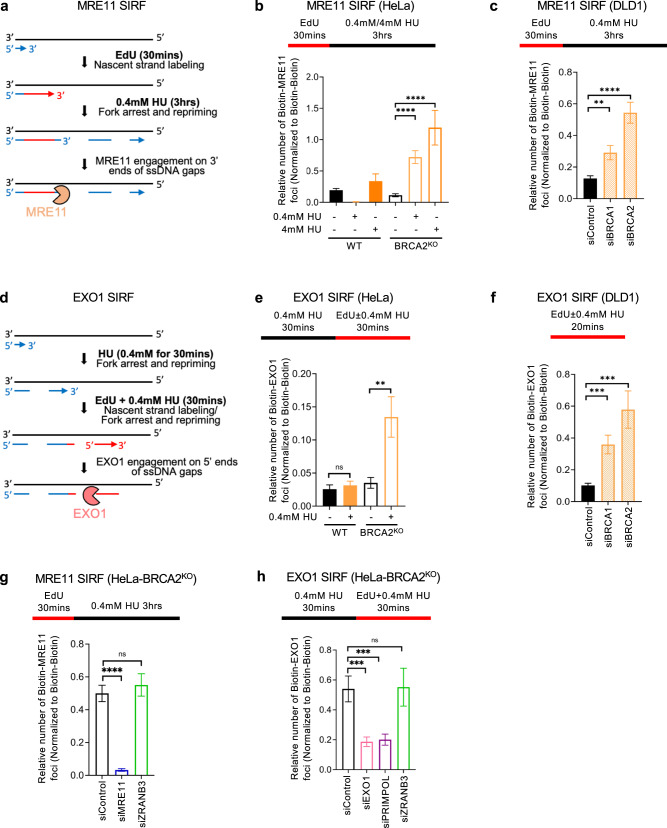
Fig. 2. MRE11 and EXO1 localize to replication stress-induced nascent strand ssDNA gaps.
a–c SIRF experiments showing that treatment with 0.4 mM HU induces binding of MRE11 to nascent DNA in HeLa-BRCA2KO cells (b) or upon depletion of BRCA1 or BRCA2 in DLD1 cells (c), similar to treatment with 4 mM HU. The labeling scheme (a) is designed to capture MRE11 binding to the 3’ end of the gap (for simplicity, only one strand, e.g., the leading strand, is shown in the schematic representation; EdU-labeled nascent DNA is indicated in red). At least 50 cells were quantified for each condition. Bars indicate the mean values, error bars represent standard errors of the mean, and asterisks indicate statistical significance (t test, two-tailed, unpaired). Schematic representations of the assay conditions are shown at the top. Western blots confirming the BRCA1 and BRCA2 knockdown are shown in Supplementary Fig. S3c, d. d, e SIRF experiments showing that treatment with 0.4 mM HU induces binding of EXO1 to nascent DNA in HeLa-BRCA2KO cells. The labeling scheme (d) is designed to capture EXO1 binding to the 5’ end of the gap (for simplicity, only one strand, e.g., the leading strand, is shown in the schematic representation; EdU-labeled nascent DNA is indicated in red). At least 60 cells were quantified for each condition. Bars indicate the mean values, error bars represent standard errors of the mean, and asterisks indicate statistical significance (t test, two-tailed, unpaired). Schematic representations of the assay conditions are shown at the top. f SIRF experiments showing that treatment with 0.4 mM HU induces binding of EXO1 to nascent DNA upon depletion of BRCA1 or BRCA2 in DLD1 cells. At least 60 cells were quantified for each condition. Bars indicate the mean values, error bars represent standard errors of the mean, and asterisks indicate statistical significance (t test, two-tailed, unpaired). Schematic representations of the assay conditions are shown at the top. g, h SIRF experiments showing that ZRANB3 knockdown does not affect binding of MRE11 (g) or EXO1 (h) induced by treatment of HeLa-BRCA2KO cells with 0.4 mM HU. At least 80 cells were quantified for each condition. Depletion of MRE11 or EXO1 respectively is used as control to confirm the specificity of the SIRF signals observed. Bars indicate the mean values, error bars represent standard errors of the mean, and asterisks indicate statistical significance (t test, two-tailed, unpaired). Schematic representations of the assay conditions are shown at the top. Source data are provided as a Source data file.

