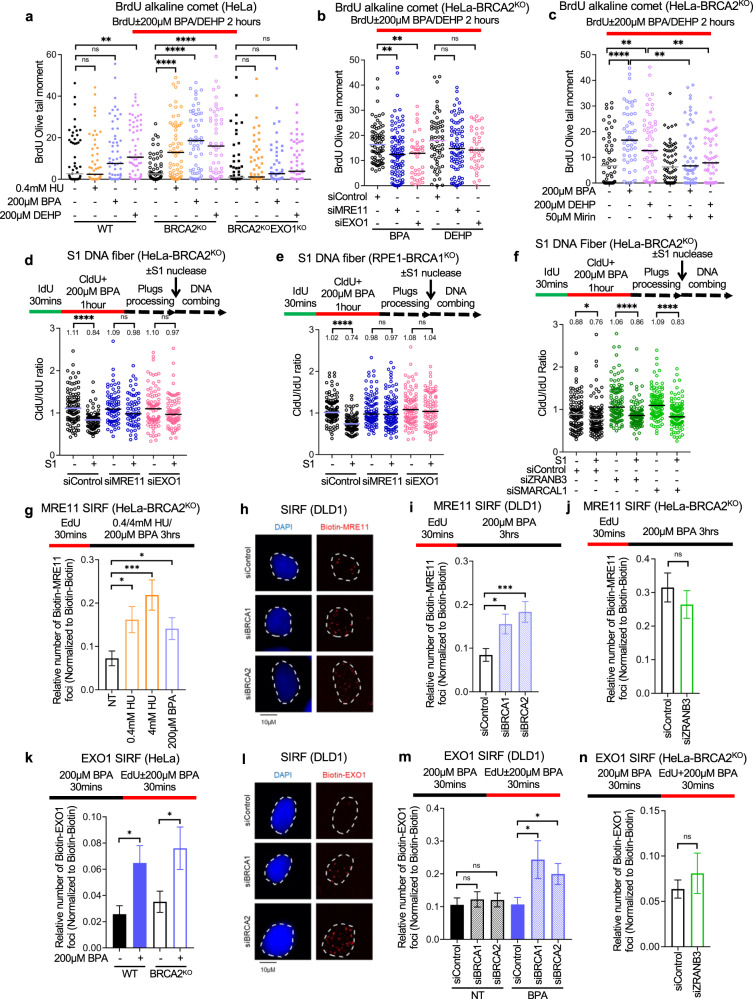
Fig. 4. BPA-induced nascent strand gaps are extended by MRE11 and EXO1.
a–c BrdU alkaline comet assay showing that EXO1 knockout (a) or knockdown (b), or MRE11 knockdown (b) or inhibition (c) suppresses the accumulation of replication-associated ssDNA gaps induced by treatment with 200 µM BPA or 200 µM DEHP in HeLa wildtype and BRCA2-knockout cells. At least 39 nuclei were quantified for each condition. The median values are marked on the graph. Asterisks indicate statistical significance (Mann–Whitney, two-tailed). d, e S1 nuclease DNA fiber combing assays showing that knockdown of MRE11 or of EXO1 suppresses the accumulation of nascent strand ssDNA gaps induced by treatment with 200 µM BPA in HeLa-BRCA2KO (d) and RPE1-BRCA1KO (e) cells. The ratio of CldU to IdU tract lengths is presented, with the median values marked on the graphs and listed at the top. At least 65 tracts were quantified for each sample. Asterisks indicate statistical significance (Mann–Whitney, two-tailed). Schematic representations of the assay conditions are shown at the top. f S1 nuclease DNA fiber combing assays showing that knockdown of ZRANB3 or of SMARCAL1 does not affect the accumulation of nascent strand ssDNA gaps induced by treatment with 200 µM BPA in HeLa-BRCA2KO cells. The ratio of CldU to IdU tract lengths is presented, with the median values marked on the graphs and listed at the top. At least 85 tracts were quantified for each sample. Asterisks indicate statistical significance (Mann–Whitney, two-tailed). Schematic representations of the assay conditions are shown at the top. g–i SIRF experiments showing that treatment with 200 µM BPA induces binding of MRE11 to nascent DNA in BRCA-deficient HeLa (g) or DLD1 (h, i) cells, similar to treatment with 4 mM HU. The labeling scheme is designed to capture MRE11 binding to the 3’ end of the gap. Representative micrographs, with scale bars representing 10 µm (h) and quantifications (g, i) are shown. At least 70 cells were quantified for each condition. Bars indicate the mean values, error bars represent standard errors of the mean, and asterisks indicate statistical significance (t test, two-tailed, unpaired). Schematic representations of the assay conditions are shown at the top. j SIRF experiments showing that MRE11 binding to nascent DNA upon treatment with 200 µM BPA in HeLa-BRCA2KO cells is not affected by ZRANB3 depletion. At least 68 cells were quantified for each condition. Bars indicate the mean values, error bars represent standard errors of the mean, and asterisks indicate statistical significance (t test, two-tailed, unpaired). Schematic representations of the assay conditions are shown at the top. k–m SIRF experiments showing that treatment with 200 µM BPA induces binding of EXO1 to nascent DNA in HeLa-BRCA2KO cells (k) or upon depletion of BRCA1 or BRCA2 in DLD1 cells (l, m). The labeling scheme is designed to capture EXO1 binding to the 5’ end of the gap. Representative micrographs, with scale bars representing 10 µm (l) and quantifications (k, m) are shown. At least 60 cells were quantified for each condition. Bars indicate the mean values, error bars represent standard errors of the mean, and asterisks indicate statistical significance (t test, two-tailed, unpaired). Schematic representations of the assay conditions are shown at the top. n SIRF experiments showing that EXO1 binding to nascent DNA upon treatment with 200 µM BPA in HeLa-BRCA2KO cells is not affected by ZRANB3 depletion. At least 80 cells were quantified for each condition. Bars indicate the mean values, error bars represent standard errors of the mean, and asterisks indicate statistical significance (t test, two-tailed, unpaired). Schematic representations of the assay conditions are shown at the top. Source data are provided as a Source data file.

