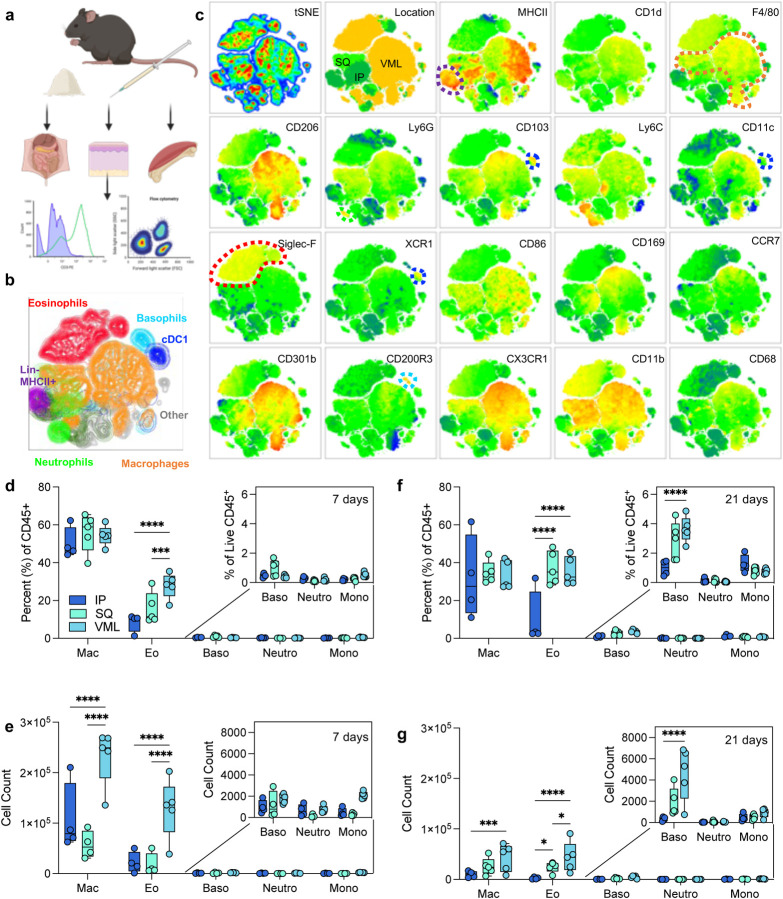
FIG 1 |. Myeloid response to biologic scaffolds in different tissue locations.
(a) Experimental workflow (b) tSNE of manually gated immune cell (CD45+) populations in ECM scaffolds (c) Expression of myeloid phenotyping markers in different islands. SQ = subcutaneous implant; IP = intraperitoneal implant; VML = volumetric muscle loss skeletal muscle injury implant. (d) Immune cell populations as a percent of live immune cells at 7 days post-implantation (dpi). (e) Immune cell counts at 7 dpi from 50 μl implants. (f) Immune cell populations as a percent of live immune cells at 21 dpi. (g) Immune cell counts at 21 dpi. Data are range, n = 4 – 5, ANOVA with Tukey posthoc. * = p < 0.05; *** = p < 0.001; **** = p < 0.0001. Schematic made with BioRender.

