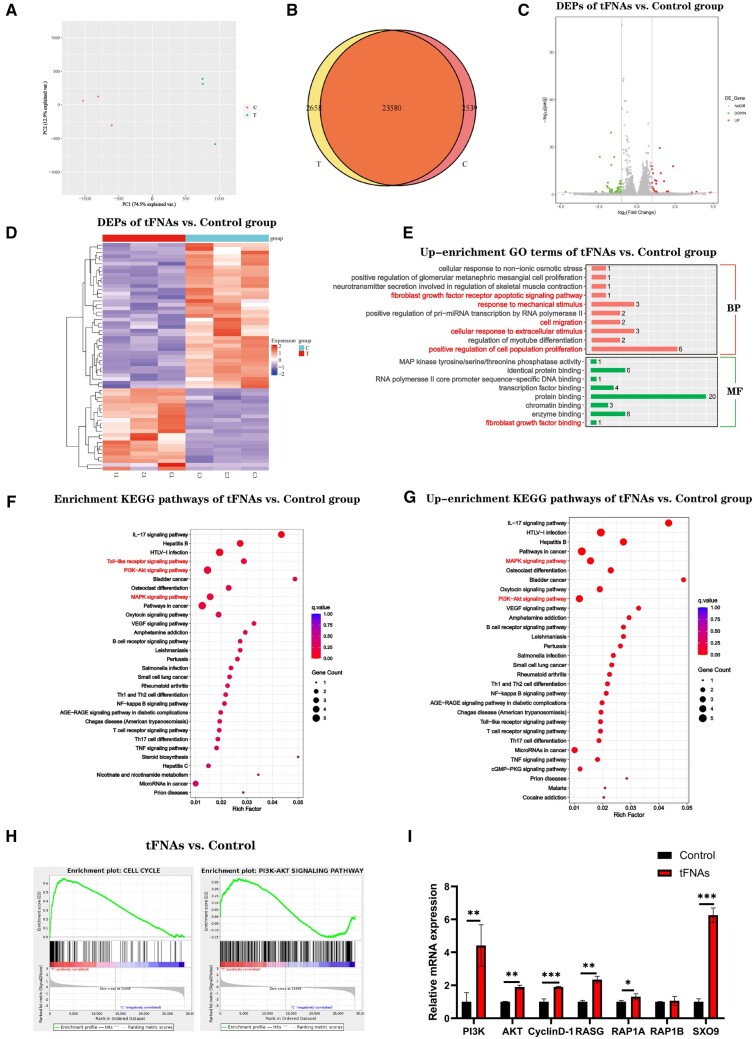
Figure 3.
mRNA transcriptome sequencing in hUMSCs under the action of tFNAs. (A) PCA of DEGs distributed in the two groups (n = 3). (B) Venn map of gene expression between different groups. Volcano plot (C) and heatmap (D) of DEGs between the two groups. (E) Up-enrichment GO bar plots of tFNAs versus control group. Enrichment (F) and up-enrichment (G) KEGG pathways. (H) GSEA enrichment analysis of cell cycle and PI3K/Akt signalling pathways between the two groups. (I) qRT–PCR analysis of genes associated with PI3K/Akt signalling pathways.

