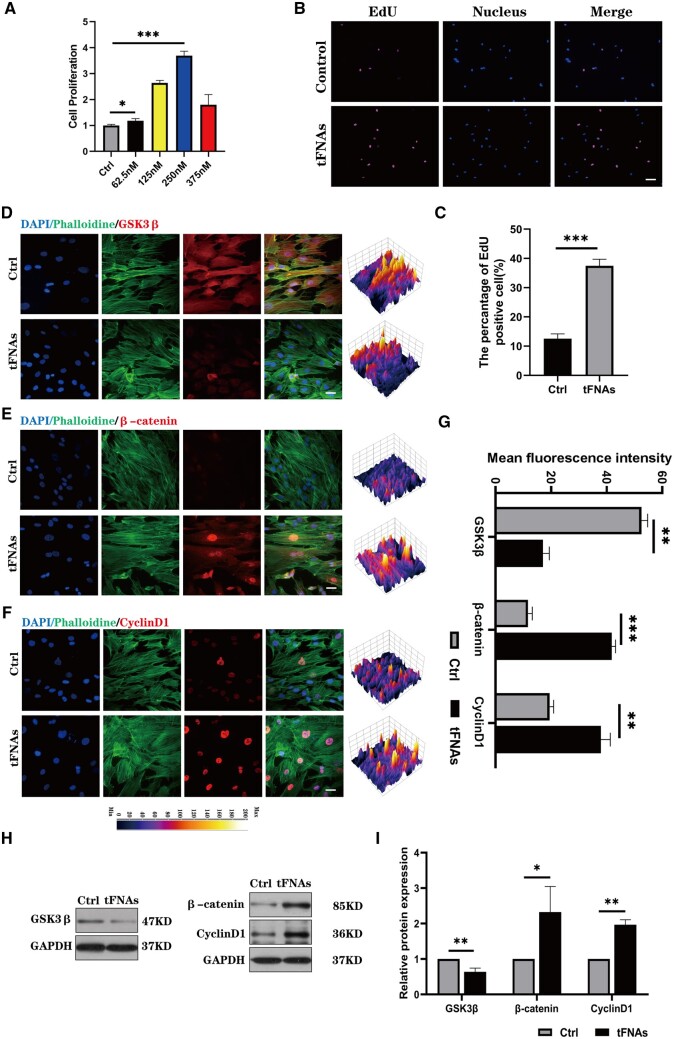
Figure 5.
Effect of tFNAs on the proliferation of hUMSCs. (A) CCK-8 proliferation assay of hUMSCs treated with tFNAs at different concentrations. (B) EdU proliferation staining images of hUMSCs treated with tFNAs (EDU: purple, nucleus: blue). Scale bars are 100 μm. (C) Semiquantitative analysis of the EdU proliferation staining assay. Data are presented as the mean ± SD (n = 3). (D–F) Immunofluorescence detection of GSK3β, β-catenin and cyclin D1 (cytoskeleton: green, nucleus: blue and protein: red). Scale bars are 25 μm. (G) Quantitative analysis of the average optical density of fluorescence images. (H) Protein expression of GSK3β, β-catenin and cyclin D1 in hUMSCs treated with tFNAs. (I) Quantitative analysis of the protein expression levels of GSK3β, β-catenin and cyclin D1. Data are presented as the mean ± SD (n = 3). Statistical analysis: *P < 0.05, **P < 0.01, ***P < 0.001.

