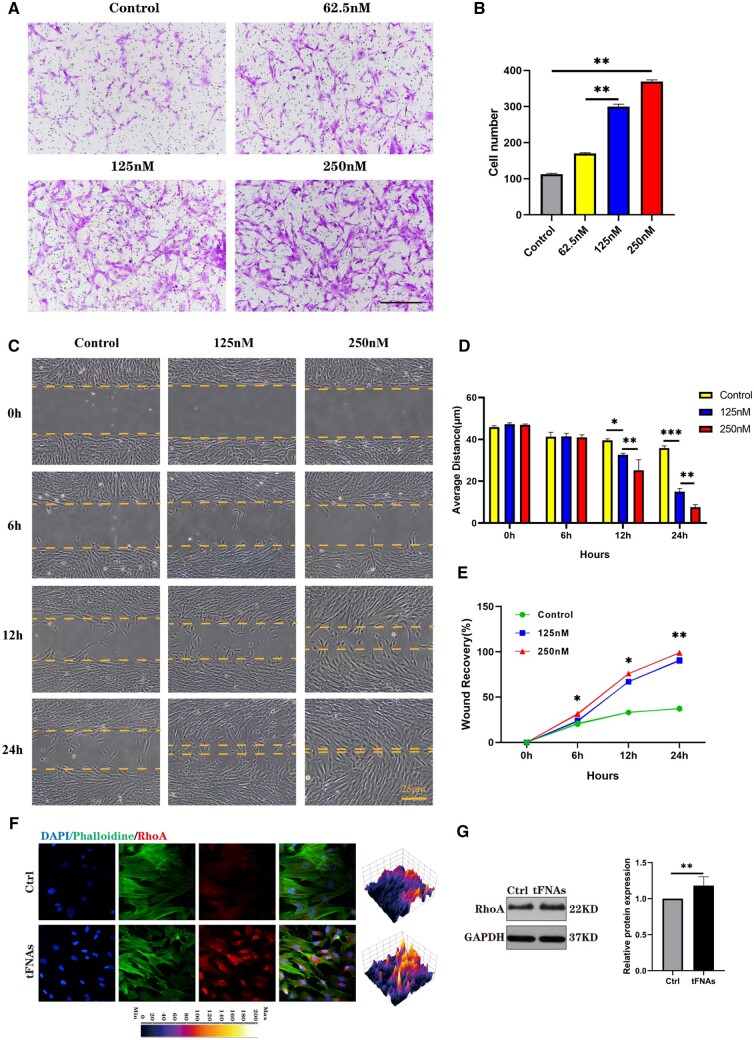
Figure 6.
Effect of tFNAs on the migration of hUMSCs. (A) Crystal violet staining of hUMSCs treated with tFNAs in transwell chamber experiments. (B) Histogram of hUMSCs migrated in the transwell chamber experiment. (C) Scratch wound healing experiments demonstrated the effect of different concentrations of tFNAs on hUMSC promotion of migration ability. Scale bars are 250 μm. (D) Quantitative analysis of the distance traversed during the scratch wound healing experiment. Data are presented as the mean ± SD (n = 3). (E) Percentage of wound recovery in the scratch wound healing experiment. Data are presented as the mean ± SD (n = 3). (F) Immunofluorescence detection of RhoA (cytoskeleton: green, nucleus: blue and protein: red). Scale bars are 25 μm. (G) Protein expression of RhoA in hUMSCs and quantitative analysis of the protein expression levels after treatment with tFNAs. Data are presented as the mean ± SD (n = 3). Statistical analysis: *P < 0.05, **P < 0.01, ***P < 0.001.

