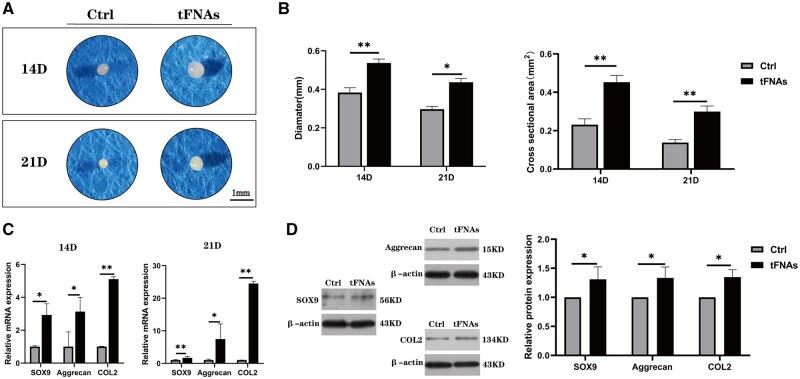
Figure 7.
Influence of tFNA on chondrogenic differentiation of hUMSCs. (A) Morphological observation of hUMSC pellets. (B) Diameter and cross-sectional area of hUMSC pellets at two time points. (C) The gene expression levels of SOX-9, ACAN and Col II in hUMSC pellets at 14 and 21 days were quantified via RT–qPCR. Data are presented as the mean ± SD (n = 3). (D) Protein expression of SOX-9, ACAN and Col II in hUMSC pellets and quantitative analysis of the protein expression levels after treatment with tFNAs. Data are presented as the mean ± SD (n = 3). Statistical analysis: *P < 0.05, **P < 0.01, ***P < 0.001.

