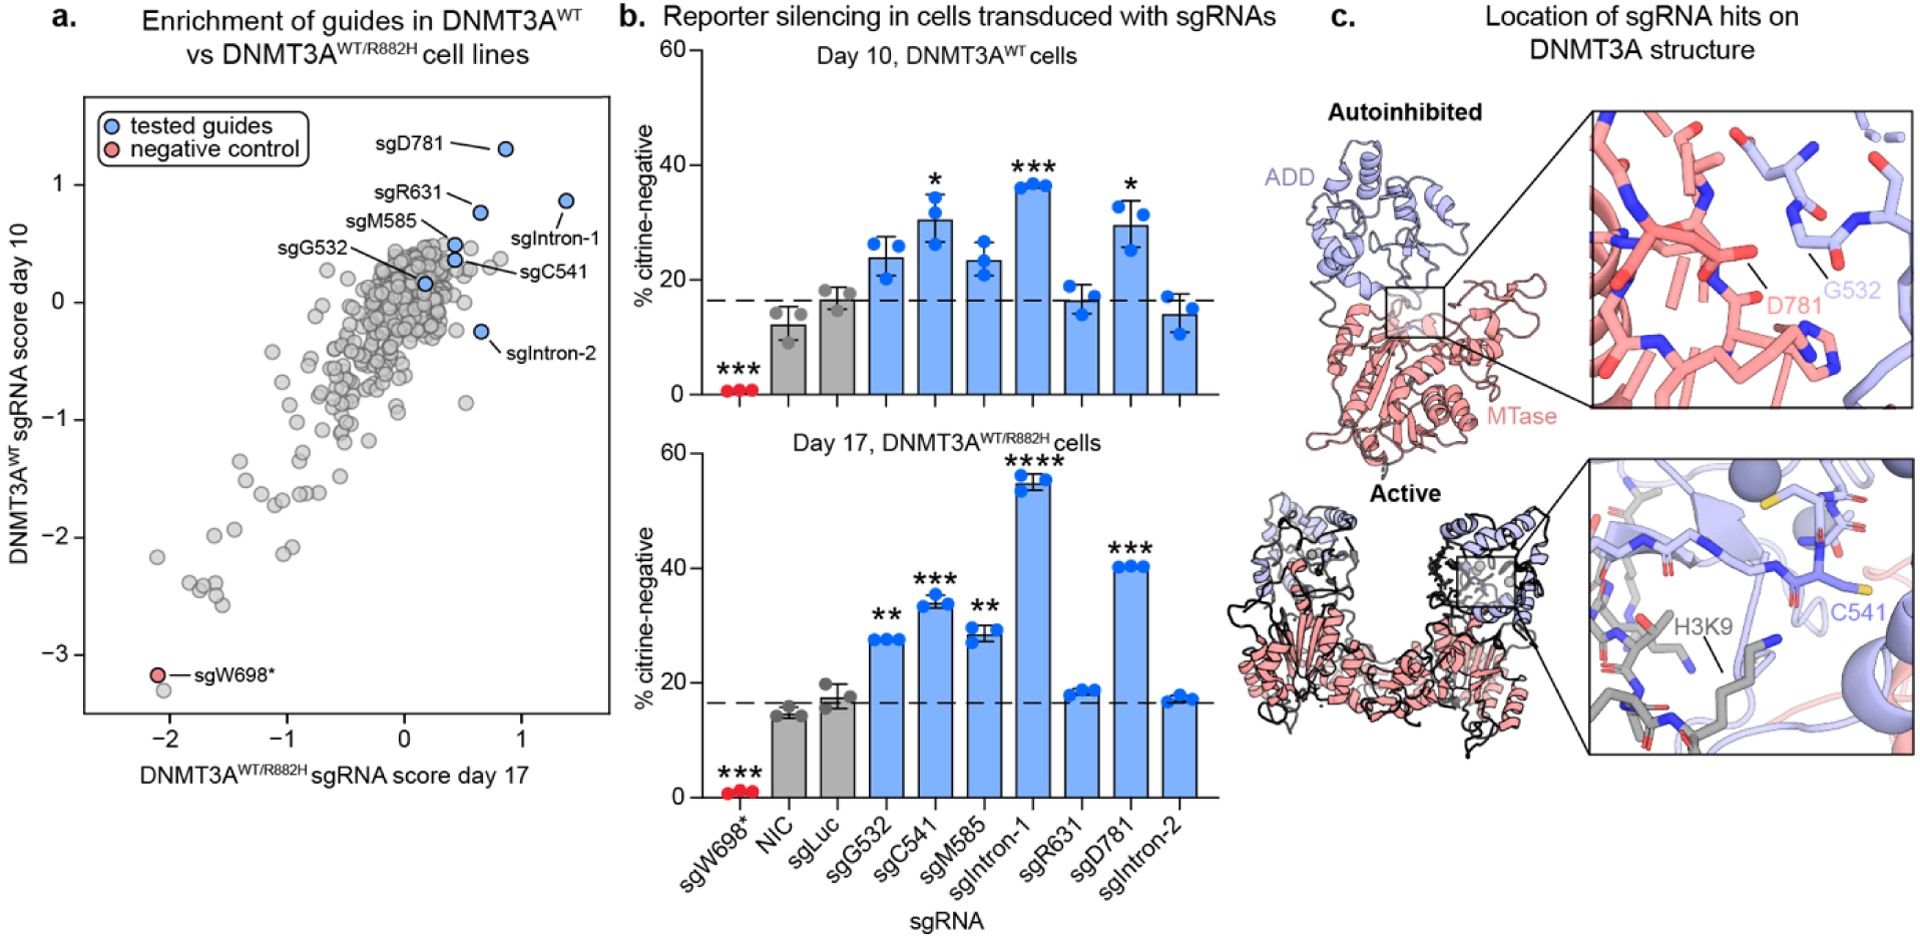
Figure 3: Validation of sgRNA hits.

a) Scatter plot showing sgRNA scores in DNMT3AWT vs DNMT3AWT/R882H reporter cells. sgRNAs tested in b) and c) are highlighted. Spearman R = 0.51, p=8.1×10−44
b) Bar plots showing % silenced cells treated with single sgRNAs after 10 (DNMT3AWT) or 17 (DNMT3AWT/R882H) days of dox treatment. sgLuc = Luciferase-targeting sgRNA, NIC = non-infection control. Data are mean ± SD of n = 3 replicates. * Correspond to significance testing using two-sided students t-tests comparing each guide to sgLuc with Bonferroni multiple hypothesis correction. *p ≤ 0.0167, **p ≤ 0.0033, ***p ≤ 0.00033, ****p ≤ 3.33 ×10⁻⁵ See Figure S4 for additional sgRNAs and replicates and table S6 for a summary of all sgRNAs tested.
c) PyMOL models showing the structural location of key activating mutants. PDB IDs: 4u7t (active) and 4u7p (autoinhibited).10
