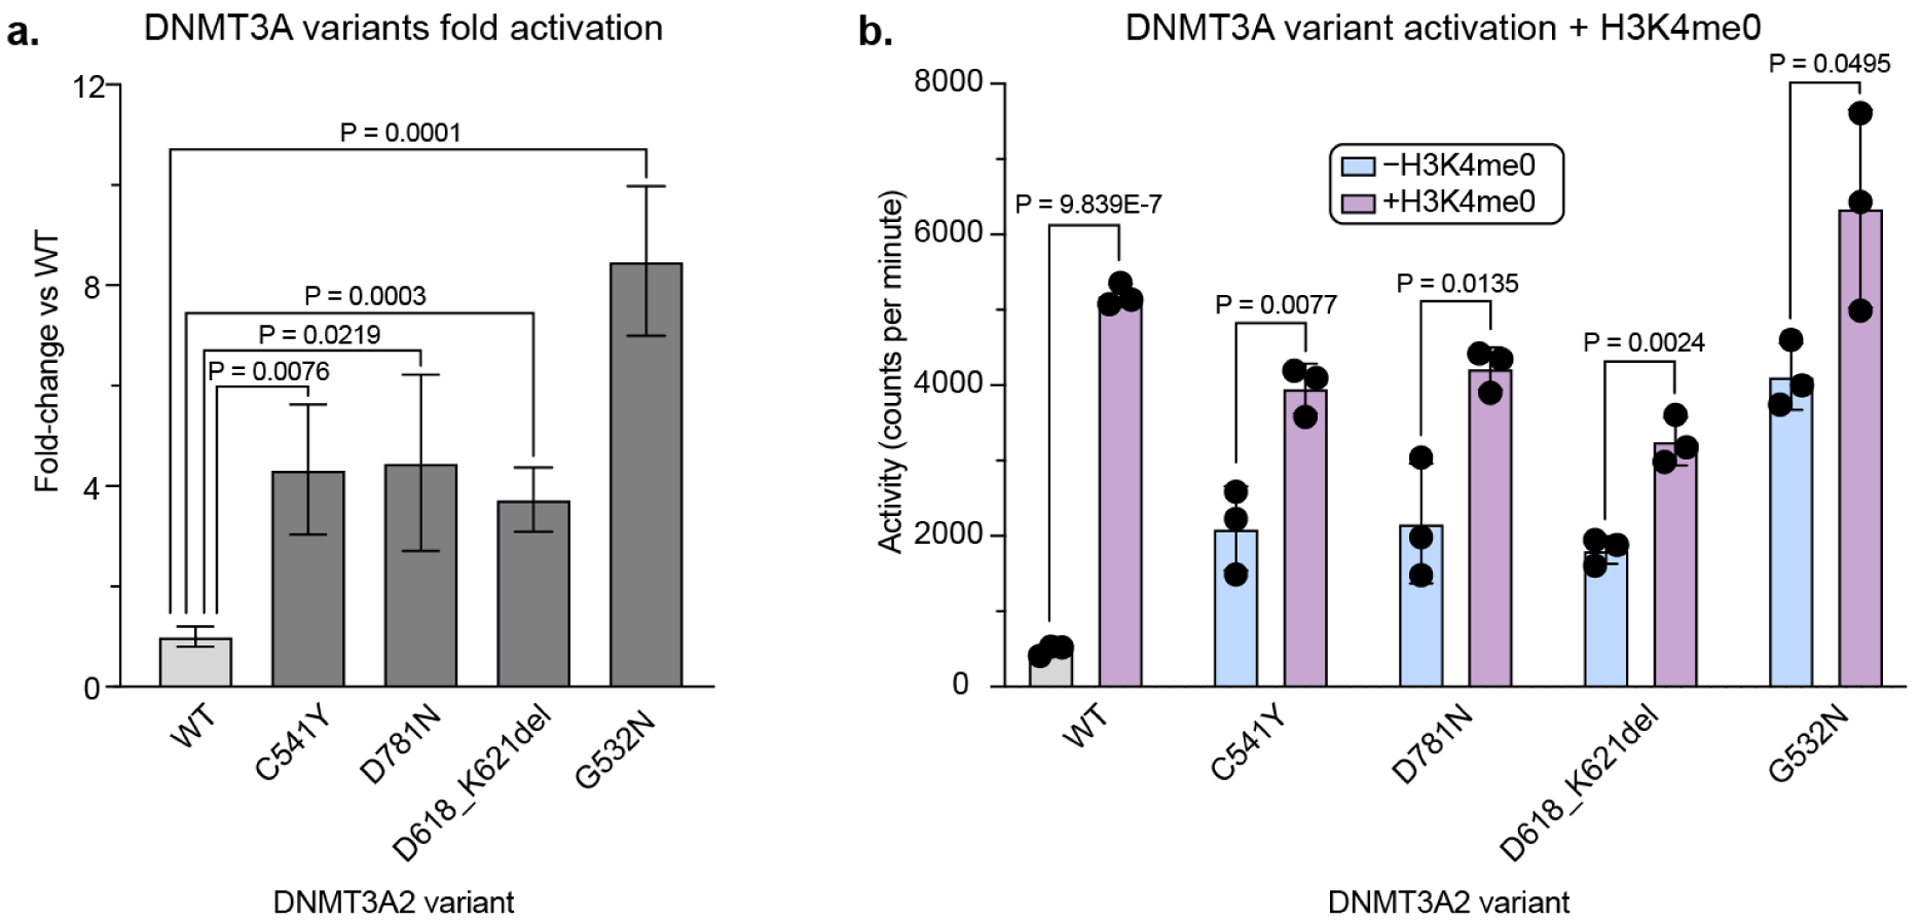
Figure 5: Biochemical validation of activating mutants.

a) Bar plot showing fold-change in DNMT3A methyltransferase activity of mutants vs WT, based on data in b). P-values were calculated by unpaired two-tailed students’ t-tests. Fold-change errors were propagated from the individual standard deviations.
b) Bar plot showing methyltransferase activity of DNMT3A mutants ± 5 μM H3K4me0. Data are mean ± SD of n = 3 replicates. P-values were calculated by unpaired two-tailed students’ t-tests. See Figure S7 for SDS-PAGE gel of purified proteins and replicate 2.
