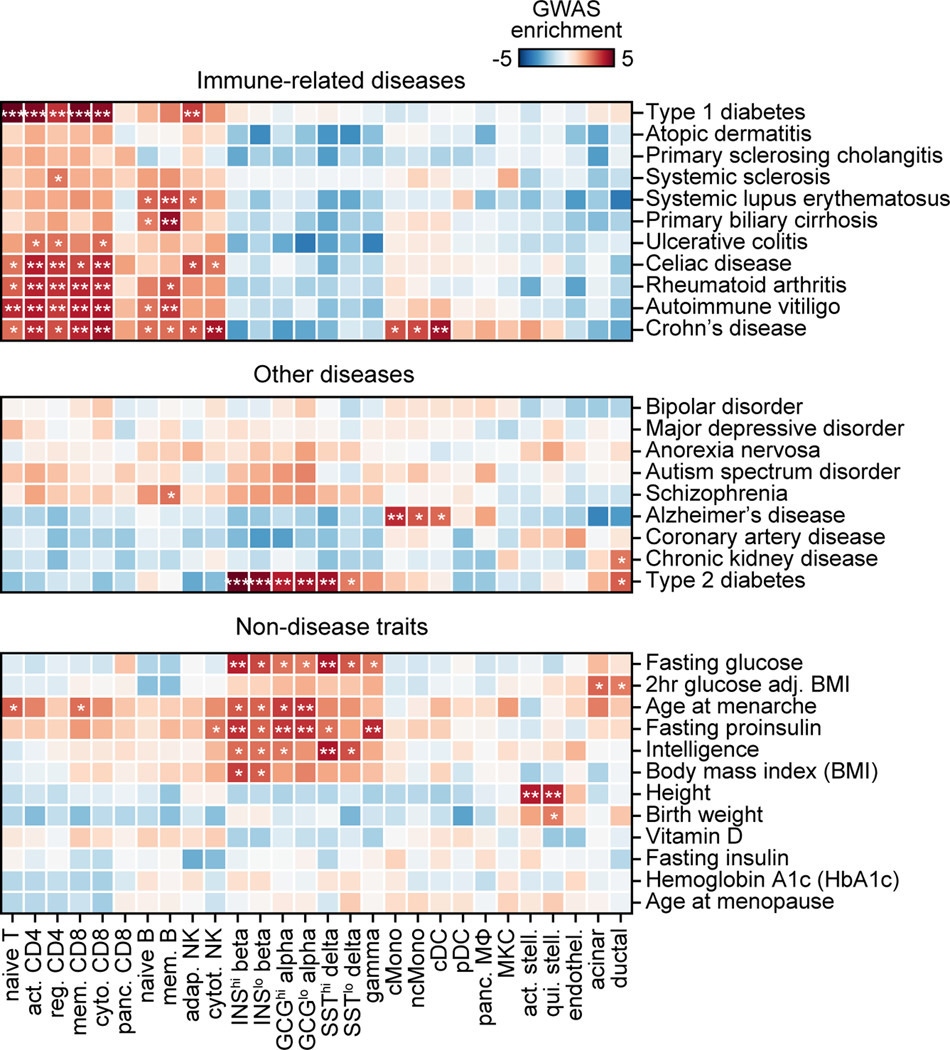
Extended Data Figure 6. GWAS enrichment for T1D compared to other diseases and traits.
Stratified LD score regression coefficient z-scores for autoimmune and inflammatory diseases (top), other diseases (middle), and non-disease quantitative endophenotypes (bottom) for cCREs active in immune and pancreatic cell types. Two sided p-values were calculated from z-scores and multiple test correction was performed using FDR. ***FDR<0.001 **FDR<0.01 *FDR<0.1.

