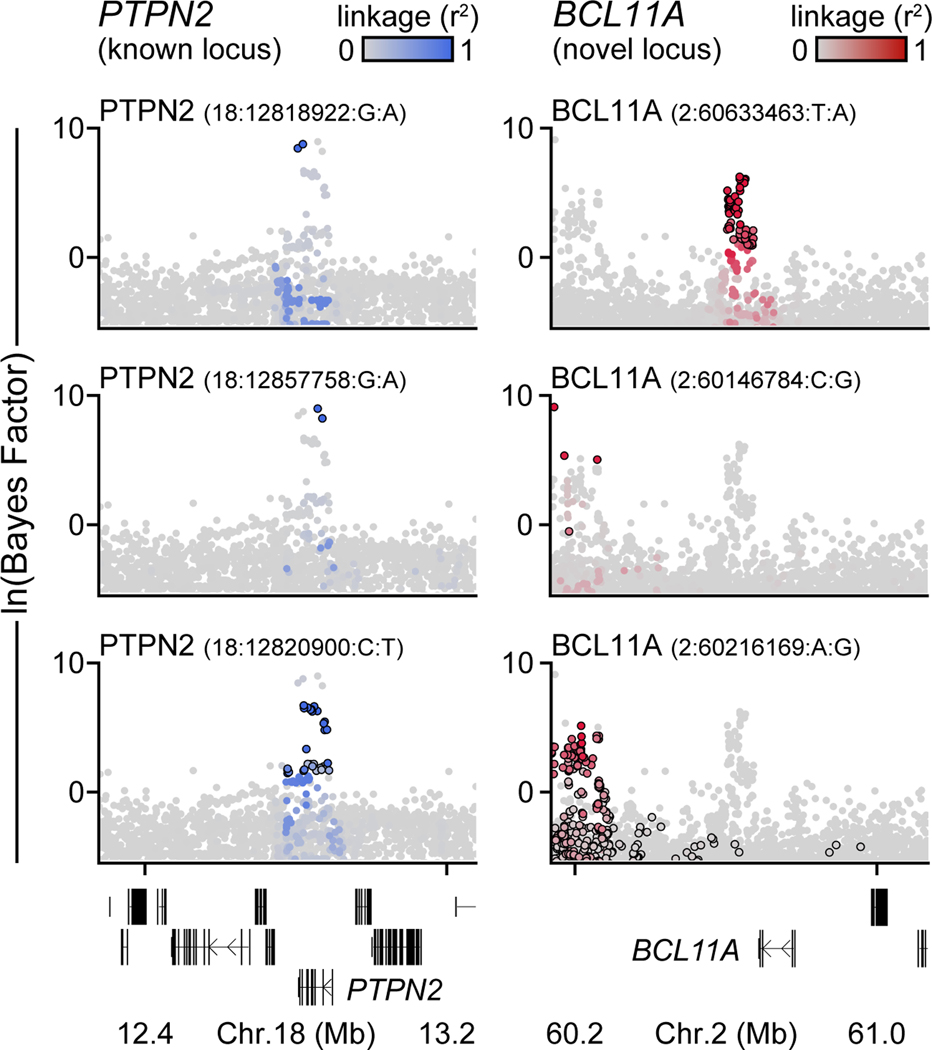
Extended Data Figure 1. Independent association signals at T1D risk loci.
Bayes factors (natural log-transformed) for independent association signals at the known PTPN2 locus (left) and the novel BCL11A locus (right). Variants are colored based on linkage disequilibrium (r2) with the index variant for each signal.

