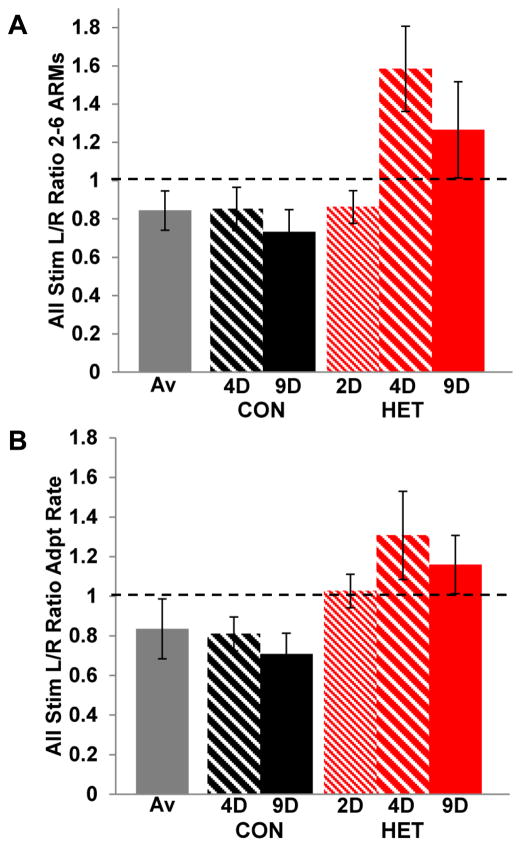
Figure 5.
Time course of exposure effects. A) ARMs are plotted as L/R ratios for each time point and housing condition: CON (black), HET (red), Av (gray). Ratios above 1 are indicative of higher ARMs in the left hemisphere, while ratios below 1 signify higher ARMs in the right hemisphere. B) Adaptation rates are plotted as L/R ratios for each time point and housing condition. Ratios above 1 represent faster adaptation rates in the left hemisphere and ratios below 1 represent faster adaptation rates in the right hemisphere. Error bars represent SEM.

