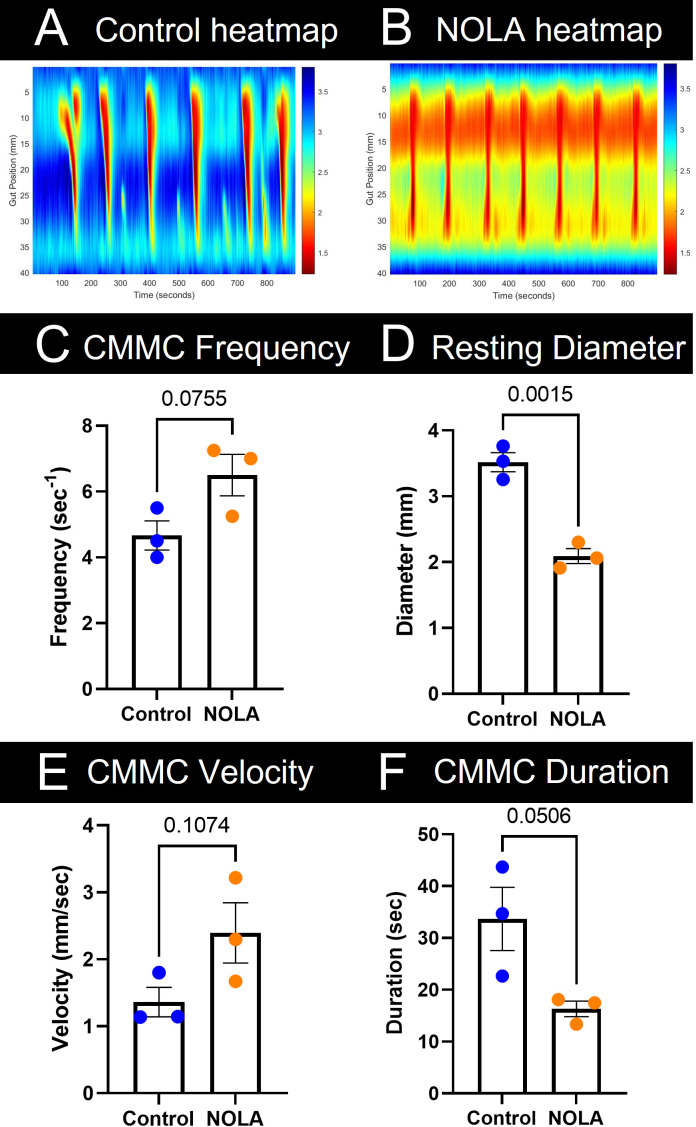
Figure 5. Analysis of colon migrating motor complexes (CMMCs) in n = 3 female mice.
Representative colonic heatmaps in (A) control and (B) NOLA conditions display contractile activity in warm tones and relaxation in cool tones. (C) CMMCs that propagated for greater than 50% of the length of the colon were counted and compared between control and NOLA groups. (D) Data tips placed at the peaks of the temporal cross-section plot were averaged to obtain the maximal resting diameter between control and NOLA groups. (E) and (F) The Manually Annotate tool was used to annotate the slope of the CMMCs propagating for greater than 50% of the length of the colon. Velocity and duration results are automatically outputted and then averaged and compared between control and NOLA groups using an Unpaired student t-test.

