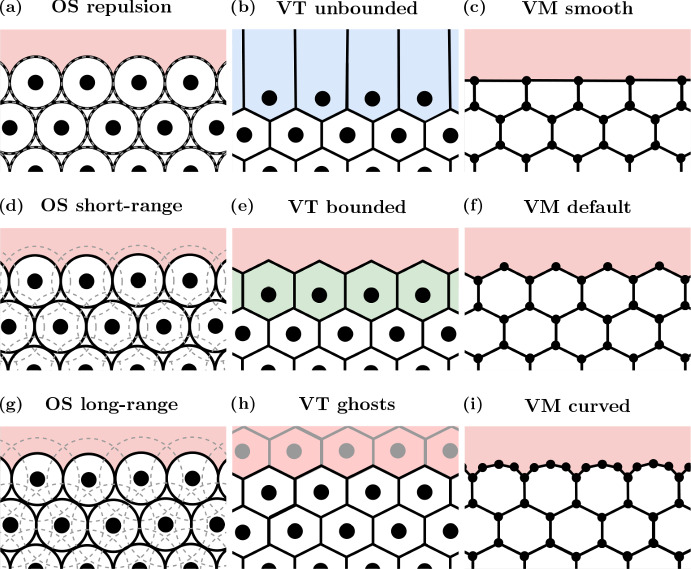
Fig. 3.
Cell boundary description schematics. OS models are pictured in (a), (d) and (g) (left column); VT models are shown in (b), (e) and (h) (middle column); and VMs are shown in (c), (f) and (i) (right column). The most computationally efficient boundaries are shown in (a)–(c) (top row). The most commonly used boundaries are displayed in (d)-(f) (middle row). The most computationally complex boundaries are shown in (g)–(i) (bottom row) (Color figure online)

