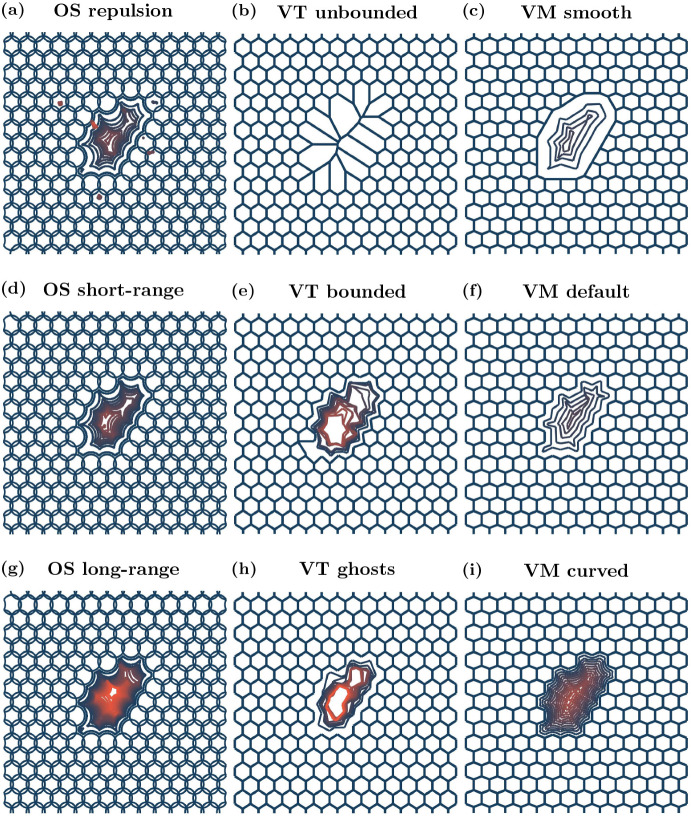
Fig. 4.
Void outlines over time. Initial cell positions and configuration in blue, and void boundary traces for each model setup at later times. Orange outlines correspond to void boundary traces at later times, if the void has not closed. Void outlines are plotted every 0.04 h until the void has zero area or 20 outlines have been plotted, whichever occurs first. The small ‘dots’ seen in (a), the OS repulsion case, are small tears that occur in the tissue at various times due to how the boundaries are defined, see Appendix C. Videos of all simulations are provided in the Supplementary Video 1 (Color figure online)

