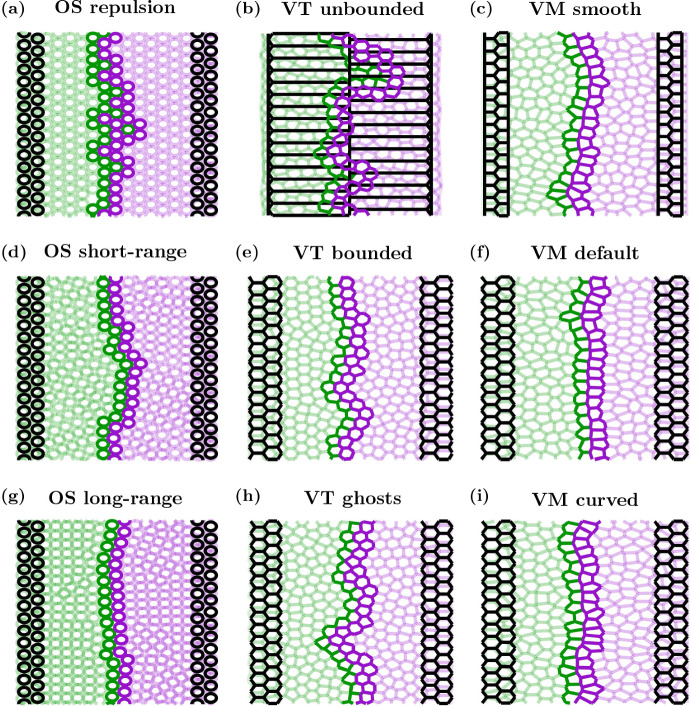
Fig. 8.
Cell outlines for example tissue collision simulations. Initial conditions are shown in black, final frames (at h) are shown by a green population on the left (cell label B) and purple population on the right (cell label A). Cells at the interface of the two populations are indicated via darker outlines. For clarity, the cells in the OS model have been plotted with a size of 0.95 CD. Videos of each simulation are provided in Supplementary Video 3 (Color figure online)

