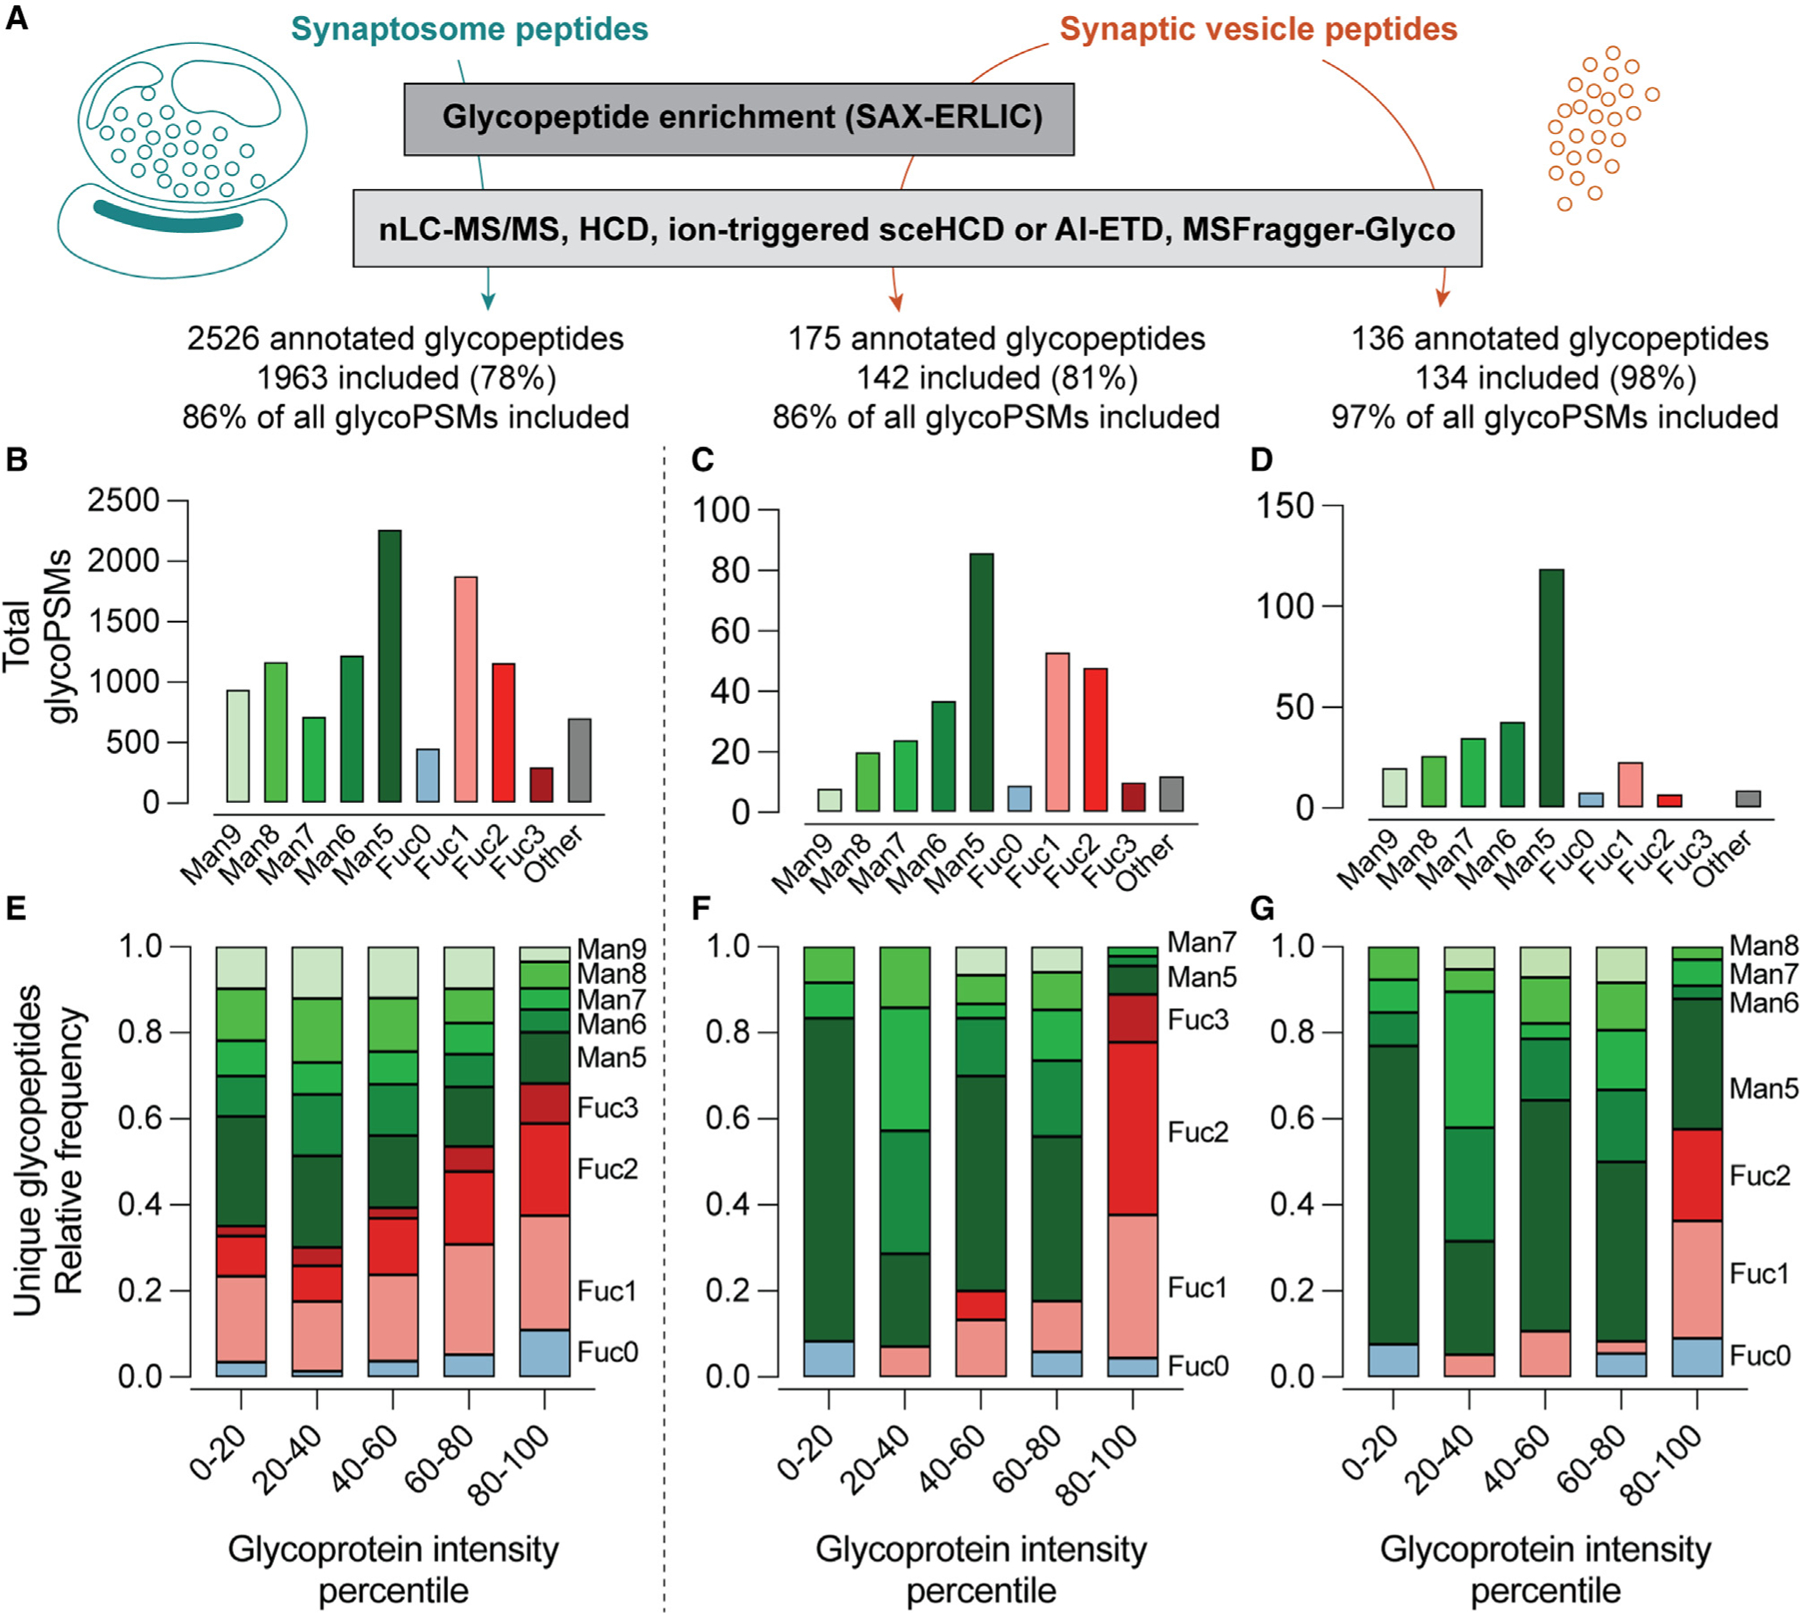
Figure 4. Glycoproteomics at the synapse.

(A) Analysis scheme. Tryptic peptides, with or without glycan enrichment by SAX-ERLIC, were analyzed using a fragmentation strategy employing sceHCD or AI-ETD. Glycans were included if they could confidently be assigned as oligomannose, complex, or hybrid N-glycans, and sialylated glycans were excluded. (B–D) Distribution of all annotated glycan peptide spectral matches (glycoPSMs) meeting inclusion criteria. Antibody-derived glycopeptides were omitted from analysis. No Fuc3 peptides were identified in the non-enriched SV samples.
(E–G) Distribution of unique annotated glycopeptides according to intensity quintile of the corresponding glycoproteins determined by standard proteomics methods (see Figure 1). SV samples demonstrate a marked increase in Fuc2 and Fuc3 sugars in the highest quintiles, while the distribution of glycopeptides in synaptosome samples was biased to a lesser degree (p < 0.0001, SV versus synaptosome samples, Mann-Whitney test).
See also Table S2, containing MSFragger search output; Table S3, containing all annotated glycoPSMs used to generate this figure; Table S4, which was used to annotate glycoPSMs according to Man or Fuc content; Table S5, which contains protein LFQ intensity values and quintile assignments used to generate (E)–(G); and Figures S2 and S3, which provide additional compositional data for synaptosome and SV glycoPSMs.
