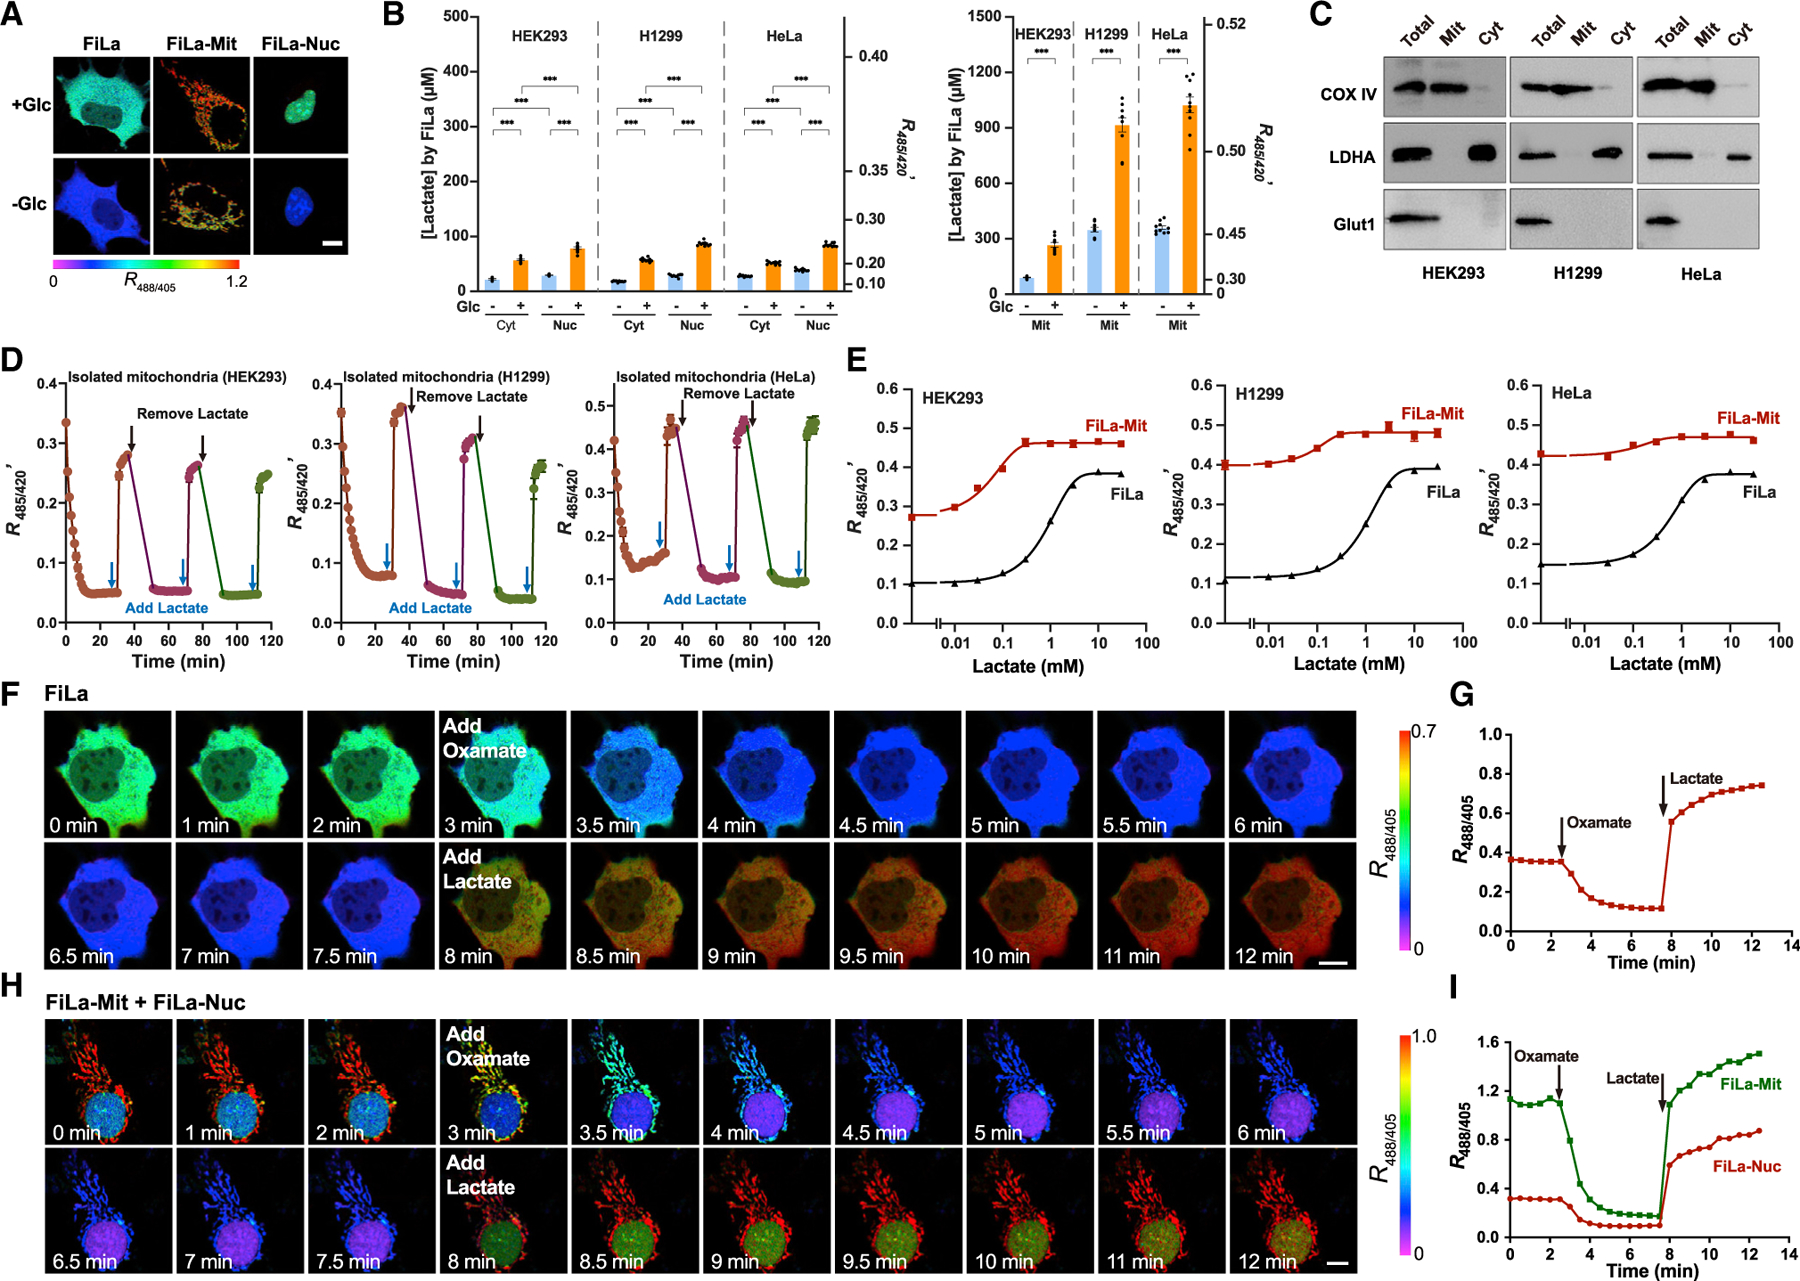
Figure 2. Lactate is highly enriched in mammalian mitochondria.

(A) Ratiometric fluorescence images of HEK293 cells expressing FiLa in cytosol, mitochondria, and nucleus. Images were pseudocolored by R488/405. Cells were cultured in the presence or absence of 25-mM glucose. Scale bars, 10 μm.
(B) Subcellular distribution (left: cytosol/nucleus, right: mitochondria) of lactate measured by FiLa in HEK293, H1299, and HeLa cells (n = 10).
(C) Western blot showing responses of total cellular, mitochondrial, and cytosolic fractions probed with antibodies to cytochrome c oxidase IV (COX IV, mitochondrial fraction marker), lactate dehydrogenase A (LDHA, cytosolic fraction marker), and glucose transporter type 1 (Glut1, plasma membrane marker).
(D) Kinetics of FiLa fluorescence in isolated mitochondria of three cell types in response to successive addition or removal of 1 mM lactate (n = 5). 0.95 × 10⁸ mitochondria from HEK293, 1.09 × 10⁸ from HeLa, and 2.25 × 10⁸ from H1299 were used for each measurement, respectively.
(E) Fluorescence responses of cells expressing FiLa-Mit or FiLa to different concentrations of lactate. Fluorescence was measured immediately after lactate addition and normalized to FiLa-C sensor (n = 4).
(F and G) Fluorescence images (F) and quantification (G) of FiLa in HEK293 cells upon 5 mM oxamate and 2 mM lactate in succession at the indicated time. Scale bars, 10 μm.
(H and I) Fluorescence images (H) and quantification (I) of FiLa expressed in the nucleus and mitochondria of HEK293 cells. Cells were treated with 5 mM oxamate and 2 mM lactate successively at the indicated time. Scale bars, 10 μm. Data are the mean ± SEM (B, D, and E). All p values were obtained using unpaired two-tailed Student’s t-test. ***p < 0.001.
See also Figure S2.
