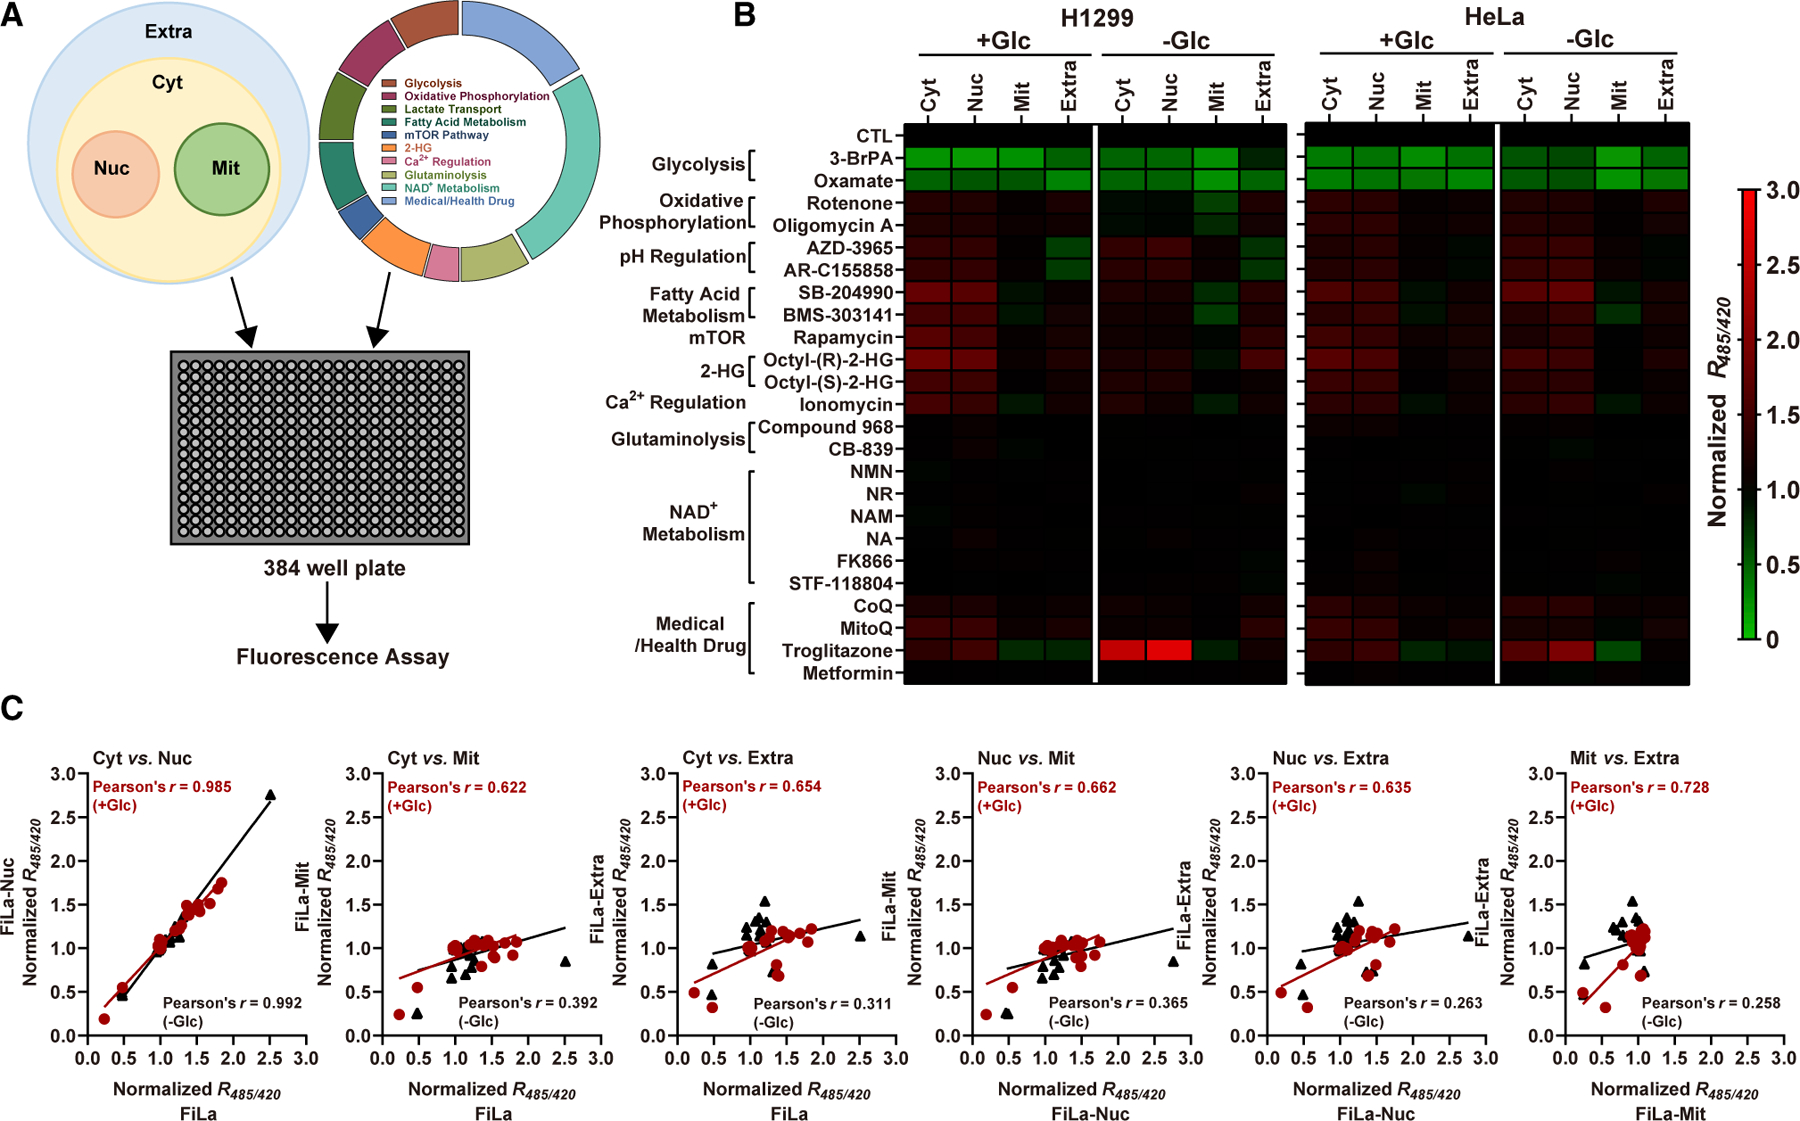
Figure 3. Subcellular lactate landscape reveals regulation of metabolism across various pathways.

(A) Schematic of FiLa-based chemical assay. Mammalian cells stably expressing FiLa in different subcellular compartments were incubated with compounds in 384-well plates for 30 min and fluorescence measured.
(B) Effects of 24 metabolic modulators targeting 10 typical metabolic pathways on subcellular lactate levels in two cancer cell lines. Experiments were conducted in 25-mM glucose (glucose-fed) or 0-mM glucose (glucose-deprived) condition. FiLa fluorescence response was corrected by FiLa-C. Data are normalized to the control group and results are shown as a heatmap, from Table S3.
(C) Pearson correlation analysis of lactate levels between every two subcellular compartments in glucose-fed (dark red) or glucose-deprived (black) H1299 cells. See also Figure S3 and Tables S3 and S4.
