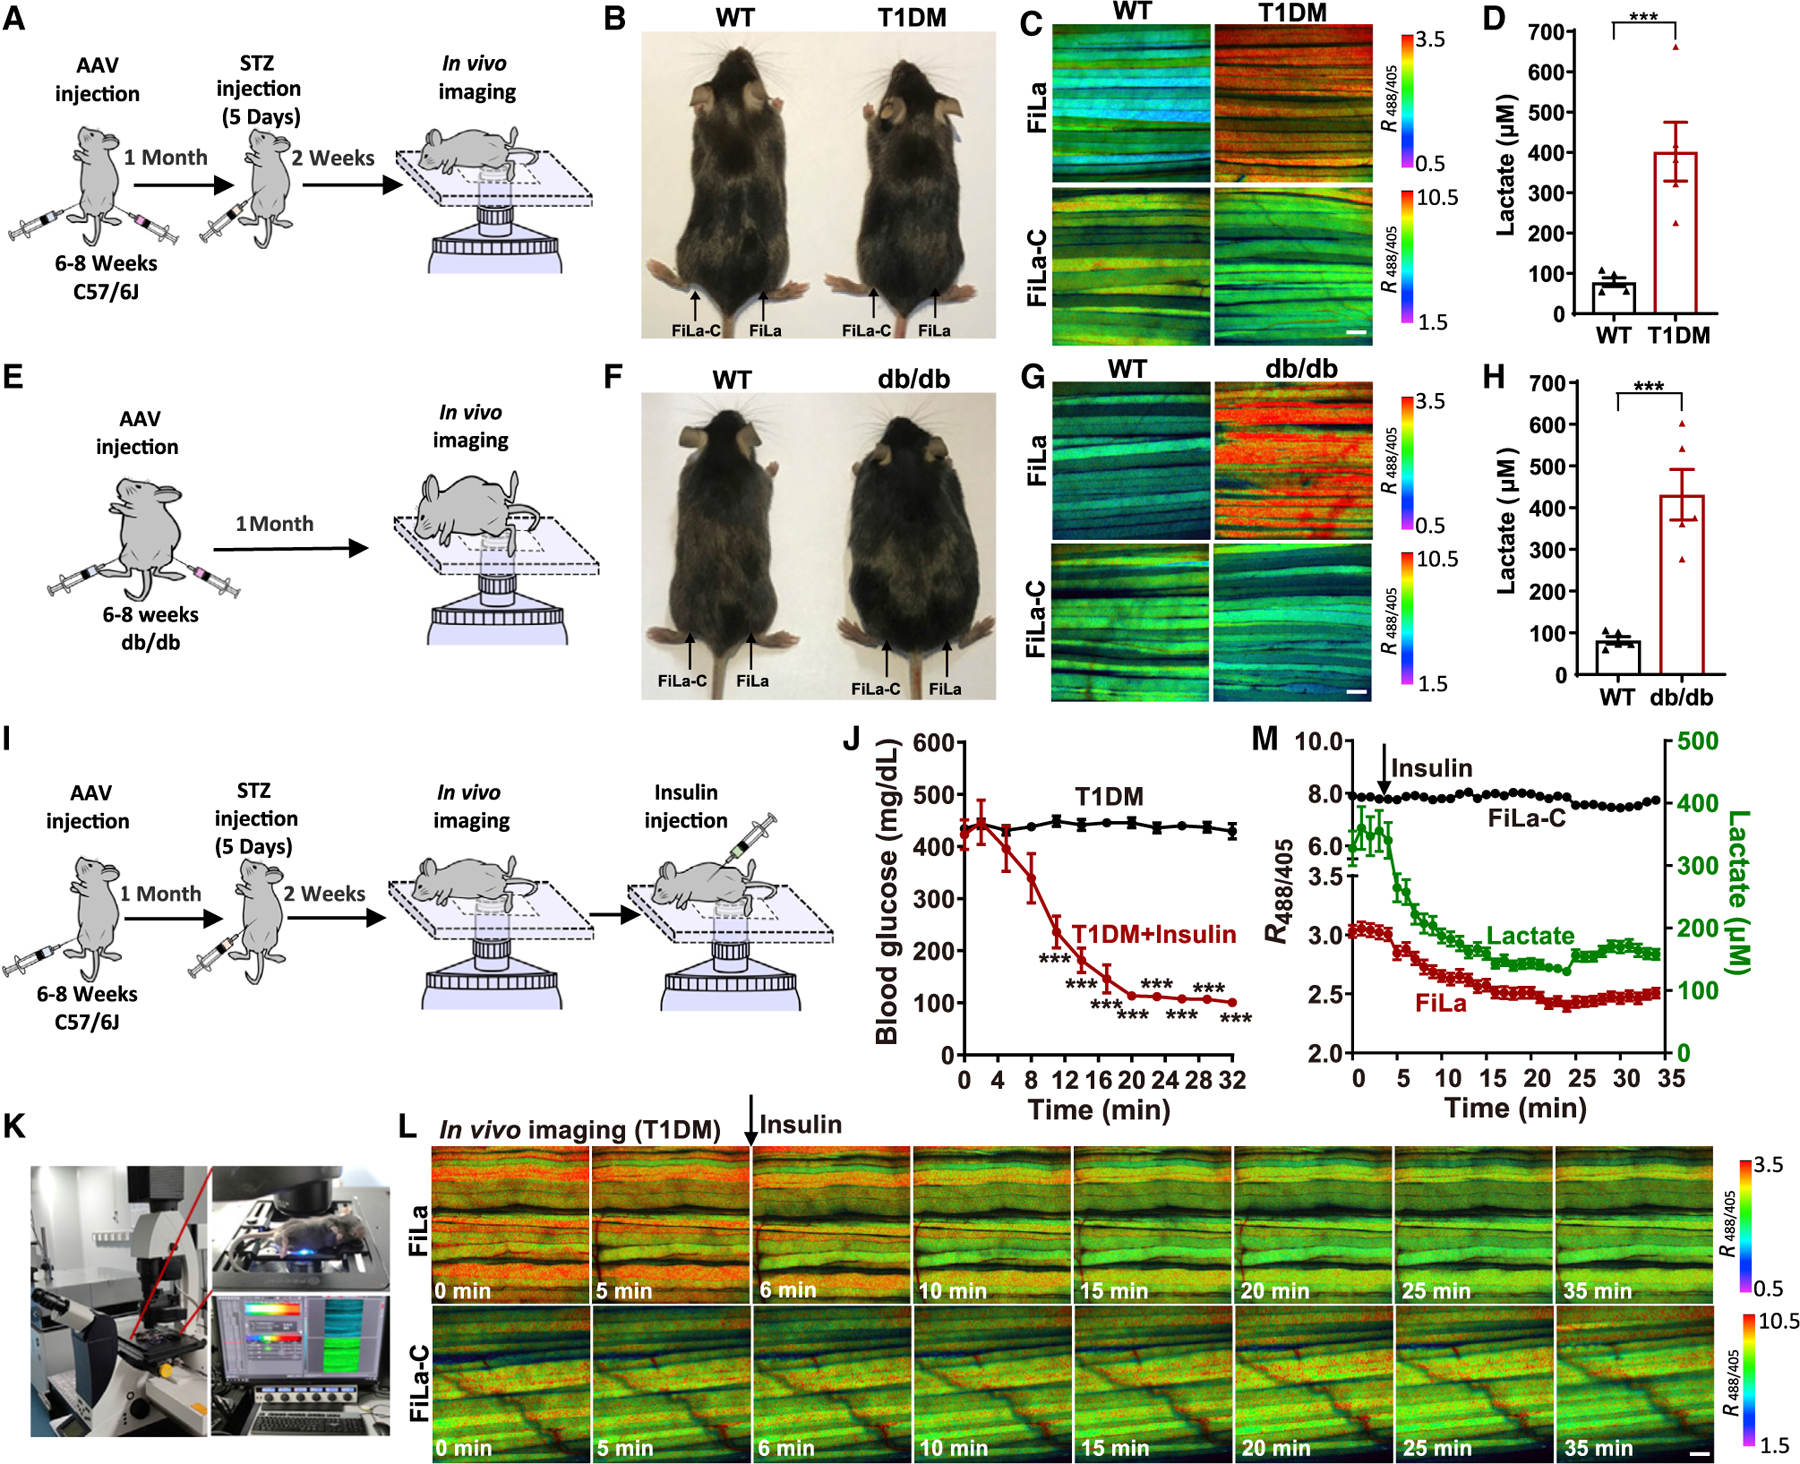
Figure 4. Imaging lactate metabolism in live mice with T1DM and T2DM.

(A) General overview of the procedure for lactate imaging in muscle tissues of living T1DM mice.
(B) WT and streptozotocin-induced T1DM mice.
(C and D) In vivo fluorescence imaging (C) and lactate quantification (D) of muscle tissue expressing FiLa in living WT and T1DM mice (n = 5 mice, 10 muscle fibers per mouse).
(E) General overview of the procedure for lactate imaging in muscle tissue of living db/db mice.
(F) WT and db/db mice (genetic models of obesity-associated T2DM).
(G and H) In vivo fluorescence imaging (G) and lactate quantification (H) of muscle tissue expressing FiLa in living WT and db/db mice (n = 5 mice, 10 muscle fibers per mouse).
(I) General overview of the procedure for lactate imaging in muscle tissues of T1DM mice by insulin therapy.
(J) Insulin sensitivity within 32 min was measured by blood glucose curve. Insulin (1.25 units/kg) was injected via intraperitoneal injection and blood glucose was measured every 3 min (n = 4 mice for T1DM; n = 6 mice for T1DM + insulin).
(K–M) In vivo fluorescence imaging (K and L) and quantification (M) of FiLa in muscle tissue of living T1DM mice treated with insulin. All fluorescence images are pseudocolored by R488/405. Scale bars, 100 μm (C, G, and L). Data are the mean ± SEM (D, H, J, and M). All p values were obtained using unpaired two-tailed Student’s t test. ***p < 0.001.
See also Figure S4.
