Figure 2.
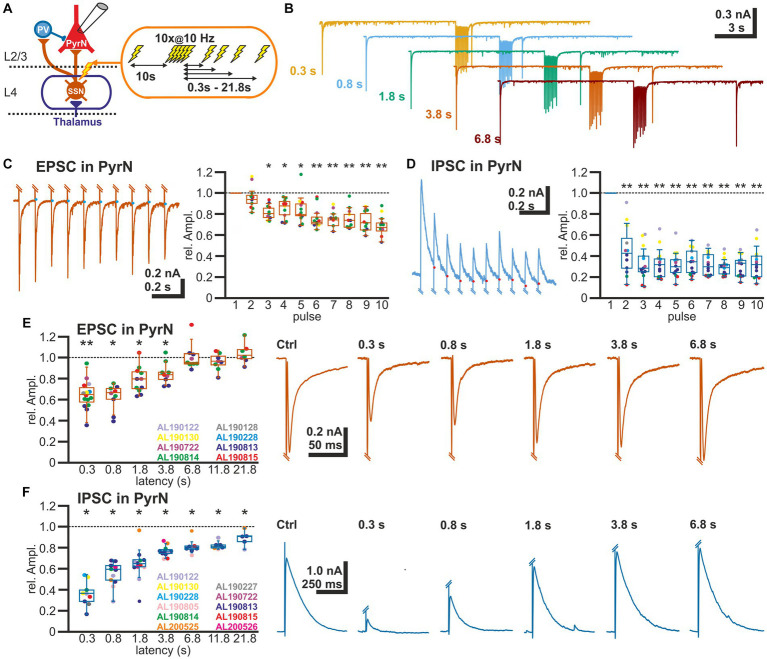
Short-term plasticity of glutamatergic and GABAergic synapses at L2/3 pyramidal neurons. (A) Schematic representation of recording and stimulation condition. An electrical stimulation protocol consisting of a control stimulus, followed by a burst stimulation and test stimuli applied at latencies between 0.3 and 21.8 s after the burst, was applied via a monopolar electrode located in L4. (B) Typical current responses to the stimulation protocol at five different latencies. (C) Amplitude of EPSCs during the burst stimulation. The blue dots indicate the basis for amplitude detection based on the exponential decay of the preceding EPSC. The box plot illustrates the significant reduction in the EPSC amplitude during the burst. Color code for data points as indicated in panel (E). (D) Amplitude of IPSCs during the burst stimulation. The red dots indicate the basis for amplitude detection based on the exponential decay of the preceding IPSC. The box plot illustrates the significant reduction in the EPSC amplitude during the burst. Color code for data points as indicated in panel (F). (E) Boxplot illustrating that the relative amplitude of EPSCs (determined at −60 mV) reveal significant STD lasting ca. 1.8 s. In the right panels, typical current traces are displayed. (F) Relative amplitude of IPSCs (determined at −0 mV) reveal a significant STD lasting at least 21.8 s. In the right panels typical current traces are displayed. Significance in panel (C,D) is tested by ANOVA with Tuckey post-hoc test and in panel (E,F) with a Wilcoxon test; significance is indicated by *p < 0.05 and **p < 0.01.

