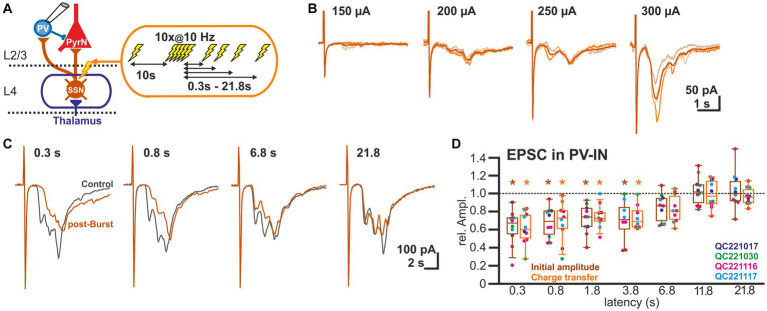
Figure 3.
Short-term plasticity of glutamatergic synapses at L2/3 PV-IN. (A) Schematic representation of recording and stimulation condition used for the experiment shown in panel (B). Each stimulation protocol consisted of a control stimulus, followed by a burst stimulation and test stimuli applied between 0.3 and 21.8 s after the burst. (B) Typical traces of glutamatergic EPSCs (recorded at −60 mV) upon increasing stimulus strength, illustrating that variable mono-and heterosynaptic inputs were observed in L2/3 PV-IN. Light traces represent single stimulations, dark traces the average of three consecutive stimulations. (C) Characteristic average traces obtained before (gray traces) and at given intervals after the burst stimulation (orange trances). The amplitudes of the responses were determined for the initial phase of the EPSCs. In addition, the charge transfer during the first 30 ms after the stimulus was determined. (D) Boxplot illustrating that initial amplitude (dark boxes) as well as charge transfer (light boxes) of glutamatergic EPSCs in PV-IN revealed a significant STD lasting 3.8 s. Significance is indicated by *p < 0.05.

